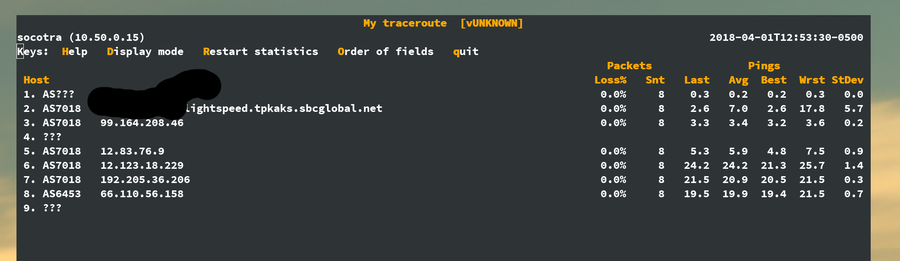
I suspect that Cloudflare and Google DNS both have POPs in Dallas, which accounts for the similar numbers to my private resolver. My point is, low latencies to datacenter-located resolver clients is great but the advantage is reduced when consumer internet users have to go across their ISP's long private fiber hauls to get to a POP. Once you're at the exchange point, it doesn't really matter which provider you choose. Go with the one with the least censorship, best security, and most privacy. For me, that's the one I run myself.
Side note: I wish AT&T was better about peering outside of their major transit POPs and better about building smaller POPs in regional hubs. For me, that would be Kansas City. Tons of big ISPs and content providers peer in KC but AT&T skips them all and appears to backhaul all Kansas traffic to DFW before doing any peering.
Cloudflare:
  64 bytes from 1.1.1.1: icmp_seq=0 ttl=128 time=2 ms
  64 bytes from 1.1.1.1: icmp_seq=1 ttl=128 time=2 ms
  64 bytes from 1.1.1.1: icmp_seq=2 ttl=128 time=2 ms
  64 bytes from 1.1.1.1: icmp_seq=3 ttl=128 time=9 ms
  64 bytes from 1.1.1.1: icmp_seq=4 ttl=128 time=2 ms
  64 bytes from 8.8.8.8: icmp_seq=0 ttl=54 time=12 ms
  64 bytes from 8.8.8.8: icmp_seq=1 ttl=54 time=11 ms
  64 bytes from 8.8.8.8: icmp_seq=2 ttl=54 time=13 ms
  64 bytes from 8.8.8.8: icmp_seq=3 ttl=54 time=45 ms
  64 bytes from 8.8.8.8: icmp_seq=4 ttl=54 time=14 ms
  64 bytes from 8.8.8.8: icmp_seq=5 ttl=54 time=11 ms
  64 bytes from 8.8.8.8: icmp_seq=6 ttl=54 time=34 ms
  64 bytes from 9.9.9.9: icmp_seq=0 ttl=53 time=10 ms
  64 bytes from 9.9.9.9: icmp_seq=1 ttl=53 time=69 ms
  64 bytes from 9.9.9.9: icmp_seq=2 ttl=53 time=14 ms
  64 bytes from 9.9.9.9: icmp_seq=3 ttl=53 time=58 ms
  64 bytes from 9.9.9.9: icmp_seq=4 ttl=53 time=52 ms
  64 bytes from 1.1.1.1: icmp_seq=0 ttl=128 time=14 ms
  64 bytes from 1.1.1.1: icmp_seq=1 ttl=128 time=14 ms
  64 bytes from 1.1.1.1: icmp_seq=2 ttl=128 time=2 ms
  64 bytes from 1.1.1.1: icmp_seq=3 ttl=128 time=3 ms
  64 bytes from 1.1.1.1: icmp_seq=4 ttl=128 time=1 ms
64 bytes from 1.1.1.1: icmp_seq=5 ttl=128 time=4 ms PING 1.1.1.1 (1.1.1.1): 56 data bytes
64 bytes from 1.1.1.1: icmp_seq=0 ttl=52 time=241.529 ms
64 bytes from 1.1.1.1: icmp_seq=1 ttl=52 time=318.034 ms
64 bytes from 1.1.1.1: icmp_seq=2 ttl=52 time=337.291 ms
64 bytes from 1.1.1.1: icmp_seq=3 ttl=52 time=255.748 ms
64 bytes from 1.1.1.1: icmp_seq=4 ttl=52 time=247.765 ms
64 bytes from 1.1.1.1: icmp_seq=5 ttl=52 time=235.611 ms
64 bytes from 1.1.1.1: icmp_seq=6 ttl=52 time=239.427 ms
64 bytes from 1.1.1.1: icmp_seq=7 ttl=52 time=247.911 ms
64 bytes from 1.1.1.1: icmp_seq=8 ttl=52 time=260.911 ms
64 bytes from 1.1.1.1: icmp_seq=9 ttl=52 time=281.153 ms
64 bytes from 1.1.1.1: icmp_seq=10 ttl=52 time=300.363 ms
64 bytes from 1.1.1.1: icmp_seq=11 ttl=52 time=234.296 ms $ ping 1.1.1.1
PING 1.1.1.1 (1.1.1.1): 56 data bytes
Request timeout for icmp_seq 0
Request timeout for icmp_seq 1
Request timeout for icmp_seq 2
Request timeout for icmp_seq 3
Request timeout for icmp_seq 4
Request timeout for icmp_seq 5
Request timeout for icmp_seq 6
Request timeout for icmp_seq 7
Request timeout for icmp_seq 8
Request timeout for icmp_seq 9
Request timeout for icmp_seq 10
$ ping 1.0.0.1
PING 1.0.0.1 (1.0.0.1): 56 data bytes
64 bytes from 1.0.0.1: icmp_seq=0 ttl=50 time=167.359 ms
64 bytes from 1.0.0.1: icmp_seq=1 ttl=50 time=165.791 ms
64 bytes from 1.0.0.1: icmp_seq=2 ttl=50 time=165.846 ms
64 bytes from 1.0.0.1: icmp_seq=3 ttl=50 time=166.755 ms
64 bytes from 1.0.0.1: icmp_seq=4 ttl=50 time=166.694 ms
64 bytes from 1.0.0.1: icmp_seq=5 ttl=50 time=166.088 ms
64 bytes from 1.0.0.1: icmp_seq=6 ttl=50 time=166.460 ms
64 bytes from 1.0.0.1: icmp_seq=7 ttl=50 time=166.668 ms
64 bytes from 1.0.0.1: icmp_seq=8 ttl=50 time=166.753 ms
64 bytes from 1.0.0.1: icmp_seq=9 ttl=50 time=165.670 ms
64 bytes from 1.0.0.1: icmp_seq=10 ttl=50 time=166.816 ms
  64 bytes from 1.1.1.1: icmp_seq=0 ttl=57 time=17.580 ms
  64 bytes from 1.1.1.1: icmp_seq=1 ttl=57 time=18.025 ms
  64 bytes from 1.1.1.1: icmp_seq=2 ttl=57 time=17.780 ms
  64 bytes from 1.1.1.1: icmp_seq=3 ttl=57 time=18.231 ms
  64 bytes from 1.1.1.1: icmp_seq=4 ttl=57 time=17.906 ms
64 bytes from 1.1.1.1: icmp_seq=5 ttl=57 time=18.447 ms PING 1.1.1.1 (1.1.1.1): 56 data bytes
64 bytes from 1.1.1.1: icmp_seq=0 ttl=59 time=22.806 ms
64 bytes from 1.1.1.1: icmp_seq=1 ttl=59 time=23.321 ms
64 bytes from 1.1.1.1: icmp_seq=2 ttl=59 time=24.379 ms
64 bytes from 1.1.1.1: icmp_seq=3 ttl=59 time=25.869 ms
64 bytes from 1.1.1.1: icmp_seq=4 ttl=59 time=24.485 ms
64 bytes from 1.1.1.1: icmp_seq=5 ttl=59 time=24.165 ms
PING 8.8.8.8 (8.8.8.8): 56 data bytes
64 bytes from 8.8.8.8: icmp_seq=0 ttl=57 time=23.005 ms
64 bytes from 8.8.8.8: icmp_seq=1 ttl=57 time=22.867 ms
64 bytes from 8.8.8.8: icmp_seq=2 ttl=57 time=24.461 ms
64 bytes from 8.8.8.8: icmp_seq=3 ttl=57 time=23.680 ms
64 bytes from 8.8.8.8: icmp_seq=4 ttl=57 time=35.581 ms
64 bytes from 8.8.8.8: icmp_seq=5 ttl=57 time=21.033 ms
64 bytes from 8.8.8.8: icmp_seq=6 ttl=57 time=41.634 ms ping 1.1.1.1
PING 1.1.1.1 (1.1.1.1) 56(84) bytes of data.
64 bytes from 1.1.1.1: icmp_seq=1 ttl=58 time=1.36 ms
64 bytes from 1.1.1.1: icmp_seq=2 ttl=58 time=1.32 ms
64 bytes from 1.1.1.1: icmp_seq=3 ttl=58 time=1.34 ms
64 bytes from 1.1.1.1: icmp_seq=4 ttl=58 time=1.38 ms
64 bytes from 1.1.1.1: icmp_seq=5 ttl=58 time=1.37 ms
ping 8.8.8.8
PING 8.8.8.8 (8.8.8.8) 56(84) bytes of data.
64 bytes from 8.8.8.8: icmp_seq=1 ttl=56 time=1.33 ms
64 bytes from 8.8.8.8: icmp_seq=2 ttl=56 time=1.38 ms
64 bytes from 8.8.8.8: icmp_seq=3 ttl=56 time=1.35 ms
64 bytes from 8.8.8.8: icmp_seq=4 ttl=56 time=1.36 ms
64 bytes from 8.8.8.8: icmp_seq=5 ttl=56 time=1.35 ms PING 1.1.1.1 (1.1.1.1): 56 data bytes
64 bytes from 1.1.1.1: icmp_seq=0 ttl=60 time=5.044 ms
64 bytes from 1.1.1.1: icmp_seq=1 ttl=60 time=6.447 ms
64 bytes from 1.1.1.1: icmp_seq=2 ttl=60 time=6.371 ms
64 bytes from 1.1.1.1: icmp_seq=3 ttl=60 time=6.308 ms
64 bytes from 1.1.1.1: icmp_seq=4 ttl=60 time=7.317 ms
64 bytes from 1.1.1.1: icmp_seq=5 ttl=60 time=5.989 ms PING 1.1.1.1 (1.1.1.1): 56 data bytes
64 bytes from 1.1.1.1: icmp_seq=0 ttl=55 time=14.053 ms
64 bytes from 1.1.1.1: icmp_seq=1 ttl=55 time=12.715 ms
64 bytes from 1.1.1.1: icmp_seq=2 ttl=55 time=13.615 ms
64 bytes from 1.1.1.1: icmp_seq=3 ttl=55 time=14.018 ms
64 bytes from 1.1.1.1: icmp_seq=4 ttl=55 time=12.261 ms
64 bytes from 1.1.1.1: icmp_seq=5 ttl=55 time=11.428 ms
64 bytes from 1.1.1.1: icmp_seq=6 ttl=55 time=11.950 ms
64 bytes from 1.1.1.1: icmp_seq=7 ttl=55 time=13.034 ms
64 bytes from 1.1.1.1: icmp_seq=8 ttl=55 time=13.679 ms
64 bytes from 1.1.1.1: icmp_seq=9 ttl=55 time=12.415 ms
64 bytes from 1.1.1.1: icmp_seq=10 ttl=55 time=12.088 msAny idea why my ISP redirects this IP?
    PING 1.1.1.1 (1.1.1.1): 56 data bytes
    64 bytes from 1.1.1.1: icmp_seq=0 ttl=57 time=5.531 ms
    64 bytes from 1.1.1.1: icmp_seq=1 ttl=57 time=4.420 ms
    64 bytes from 1.1.1.1: icmp_seq=2 ttl=57 time=5.450 ms
    64 bytes from 1.1.1.1: icmp_seq=3 ttl=57 time=5.438 ms
    64 bytes from 1.1.1.1: icmp_seq=4 ttl=57 time=4.231 ms
    64 bytes from 1.1.1.1: icmp_seq=5 ttl=57 time=5.933 ms


    PING 8.8.8.8 (8.8.8.8): 56 data bytes
    64 bytes from 8.8.8.8: icmp_seq=0 ttl=57 time=6.440 ms
    64 bytes from 8.8.8.8: icmp_seq=1 ttl=57 time=4.574 ms
    64 bytes from 8.8.8.8: icmp_seq=2 ttl=57 time=4.684 ms
    64 bytes from 8.8.8.8: icmp_seq=3 ttl=57 time=4.992 ms
    64 bytes from 8.8.8.8: icmp_seq=4 ttl=57 time=5.942 ms
64 bytes from 8.8.8.8: icmp_seq=5 ttl=57 time=5.955 ms$ ping 1.1.1.1 PING 1.1.1.1 (1.1.1.1): 56 data bytes 64 bytes from 1.1.1.1: icmp_seq=0 ttl=58 time=111.781 ms 64 bytes from 1.1.1.1: icmp_seq=1 ttl=58 time=102.982 ms 64 bytes from 1.1.1.1: icmp_seq=2 ttl=58 time=102.206 ms 64 bytes from 1.1.1.1: icmp_seq=3 ttl=58 time=110.135 ms 64 bytes from 1.1.1.1: icmp_seq=4 ttl=58 time=110.085 ms
$ ping 8.8.8.8 PING 8.8.8.8 (8.8.8.8): 56 data bytes 64 bytes from 8.8.8.8: icmp_seq=0 ttl=58 time=6.886 ms 64 bytes from 8.8.8.8: icmp_seq=1 ttl=58 time=5.475 ms 64 bytes from 8.8.8.8: icmp_seq=2 ttl=58 time=5.674 ms 64 bytes from 8.8.8.8: icmp_seq=3 ttl=58 time=5.557 ms 64 bytes from 8.8.8.8: icmp_seq=4 ttl=58 time=7.066 ms
$ ping 9.9.9.9 PING 9.9.9.9 (9.9.9.9): 56 data bytes 64 bytes from 9.9.9.9: icmp_seq=0 ttl=58 time=5.880 ms 64 bytes from 9.9.9.9: icmp_seq=1 ttl=58 time=5.534 ms 64 bytes from 9.9.9.9: icmp_seq=2 ttl=58 time=5.251 ms 64 bytes from 9.9.9.9: icmp_seq=3 ttl=58 time=5.194 ms 64 bytes from 9.9.9.9: icmp_seq=4 ttl=58 time=5.698 ms
Your pings also have the same thing showing up 128 vs 53. I tried on my laptop and get something simmilar. traceroute to 1.1.1.1 is 1 hop which is wrong. 1.0.0.1 shows a few hops.
`dig google.com @1.1.1.1` doesn't work for me.
Edit: Assuming this is the right file: https://github.com/iputils/iputils/blob/master/ping.c, I don't see the reverse lookup code anywhere. But then I'm not the most proficient in reading linux code.

  $ ping 1.1.1.1
  PING 1.1.1.1 (1.1.1.1) 56(84) bytes of data.
  64 bytes from 1.1.1.1: icmp_seq=1 ttl=56 time=10.8 ms
  64 bytes from 1.1.1.1: icmp_seq=2 ttl=56 time=11.3 ms
  64 bytes from 1.1.1.1: icmp_seq=3 ttl=56 time=10.7 ms
  64 bytes from 1.1.1.1: icmp_seq=4 ttl=56 time=10.9 ms

  PING 8.8.8.8 (8.8.8.8) 56(84) bytes of data.
  64 bytes from 8.8.8.8: icmp_seq=1 ttl=60 time=10.7 ms
  64 bytes from 8.8.8.8: icmp_seq=2 ttl=60 time=11.3 ms
  64 bytes from 8.8.8.8: icmp_seq=3 ttl=60 time=11.1 ms
64 bytes from 8.8.8.8: icmp_seq=4 ttl=60 time=10.5 ms $ ping 1.1.1.1
Pinging 1.1.1.1 with 32 bytes of data:
Reply from 1.1.1.1: bytes=32 time=4ms TTL=60
Reply from 1.1.1.1: bytes=32 time=4ms TTL=60
Reply from 1.1.1.1: bytes=32 time=4ms TTL=60
Reply from 1.1.1.1: bytes=32 time=4ms TTL=60
$ ping 8.8.8.8
Pinging 8.8.8.8 with 32 bytes of data:
Reply from 8.8.8.8: bytes=32 time=27ms TTL=60
Reply from 8.8.8.8: bytes=32 time=27ms TTL=60
Reply from 8.8.8.8: bytes=32 time=27ms TTL=60
Reply from 8.8.8.8: bytes=32 time=28ms TTL=60
    $ ping 202.180.64.10

    Pinging 202.180.64.10 with 32 bytes of data:
    Reply from 202.180.64.10: bytes=32 time=11ms TTL=61
    Reply from 202.180.64.10: bytes=32 time=11ms TTL=61
    Reply from 202.180.64.10: bytes=32 time=11ms TTL=61
Reply from 202.180.64.10: bytes=32 time=11ms TTL=61 $ ping -c 4 1.1.1.1
PING 1.1.1.1 (1.1.1.1) 56(84) bytes of data.
64 bytes from 1.1.1.1: icmp_seq=1 ttl=56 time=29.0 ms
64 bytes from 1.1.1.1: icmp_seq=2 ttl=56 time=27.7 ms
64 bytes from 1.1.1.1: icmp_seq=3 ttl=56 time=30.5 ms
64 bytes from 1.1.1.1: icmp_seq=4 ttl=56 time=28.6 ms
--- 1.1.1.1 ping statistics ---
4 packets transmitted, 4 received, 0% packet loss, time 3004ms
rtt min/avg/max/mdev = 27.731/28.993/30.573/1.028 ms
$ ping -c 4 8.8.8.8
PING 8.8.8.8 (8.8.8.8) 56(84) bytes of data.
64 bytes from 8.8.8.8: icmp_seq=1 ttl=55 time=27.7 ms
64 bytes from 8.8.8.8: icmp_seq=2 ttl=55 time=30.7 ms
64 bytes from 8.8.8.8: icmp_seq=3 ttl=55 time=28.5 ms
64 bytes from 8.8.8.8: icmp_seq=4 ttl=55 time=30.6 ms
--- 8.8.8.8 ping statistics ---
4 packets transmitted, 4 received, 0% packet loss, time 3005ms
rtt min/avg/max/mdev = 27.772/29.409/30.710/1.280 ms
  PING 1.1.1.1 (1.1.1.1) 56(84) bytes of data.
  64 bytes from 1.1.1.1: icmp_seq=1 ttl=59 time=7.65 ms
  64 bytes from 1.1.1.1: icmp_seq=2 ttl=59 time=8.53 ms
  64 bytes from 1.1.1.1: icmp_seq=3 ttl=59 time=10.2 ms
  64 bytes from 1.1.1.1: icmp_seq=4 ttl=59 time=8.04 ms
  64 bytes from 1.1.1.1: icmp_seq=5 ttl=59 time=7.92 ms
  64 bytes from 1.1.1.1: icmp_seq=6 ttl=59 time=7.85 ms
  64 bytes from 1.1.1.1: icmp_seq=7 ttl=59 time=7.88 ms
  64 bytes from 1.1.1.1: icmp_seq=8 ttl=59 time=7.73 ms
64 bytes from 1.1.1.1: icmp_seq=9 ttl=59 time=7.73 ms64 bytes from 1.1.1.1: icmp_seq=0 ttl=60 time=0.966 ms
Outstanding.
64 bytes from 8.8.8.8: icmp_seq=0 ttl=59 time=25.478 ms
Not so great.
    iMac   ~ ping 1.1.1.1
    PING 1.1.1.1 (1.1.1.1): 56 data bytes
    64 bytes from 1.1.1.1: icmp_seq=0 ttl=64 time=0.688 ms
    64 bytes from 1.1.1.1: icmp_seq=1 ttl=64 time=0.814 ms
    64 bytes from 1.1.1.1: icmp_seq=2 ttl=64 time=1.153 ms
    64 bytes from 1.1.1.1: icmp_seq=3 ttl=64 time=0.752 ms
    64 bytes from 1.1.1.1: icmp_seq=4 ttl=64 time=0.755 ms
    64 bytes from 1.1.1.1: icmp_seq=5 ttl=64 time=0.789 ms
    64 bytes from 1.1.1.1: icmp_seq=6 ttl=64 time=0.876 ms
    64 bytes from 1.1.1.1: icmp_seq=7 ttl=64 time=0.869 ms
    64 bytes from 1.1.1.1: icmp_seq=8 ttl=64 time=0.830 ms
    64 bytes from 1.1.1.1: icmp_seq=9 ttl=64 time=1.387 ms
    --- 1.1.1.1 ping statistics ---
    10 packets transmitted, 10 packets received, 0.0% packet loss
    round-trip min/avg/max/stddev = 0.688/0.891/1.387/0.204 ms
    traceroute to 1.1.1.1 (1.1.1.1), 64 hops max, 52 byte packets
1 1dot1dot1dot1.cloudflare-dns.com (1.1.1.1) 1.117 ms 0.710 ms 0.727 msUsing 1.0.0.1 works.
On a Unifi nano hd, with moderate signal, my latency only goes up 1ms.
Getting ~3.5 ms on wifi to 1.1.1.1, ~2.5ms ethernet
Sucks that VDSL2 no longer supports fastpath, not that I could use it on an ADSL line due to bonding anyway :/
  Pinging 1.1.1.1 with 32 bytes of data:
  Reply from 1.1.1.1: bytes=32 time=1ms TTL=128
  Reply from 1.1.1.1: bytes=32 time=1ms TTL=128
  Reply from 1.1.1.1: bytes=32 time=1ms TTL=128
  Reply from 1.1.1.1: bytes=32 time=2ms TTL=128

  Pinging 8.8.8.8 with 32 bytes of data:
  Reply from 8.8.8.8: bytes=32 time=91ms TTL=37
  Request timed out.
  Reply from 8.8.8.8: bytes=32 time=66ms TTL=37
  Request timed out.

  Pinging 1.0.0.1 with 32 bytes of data:
  Reply from 1.0.0.1: bytes=32 time=146ms TTL=50
  Reply from 1.0.0.1: bytes=32 time=144ms TTL=50
  Reply from 1.0.0.1: bytes=32 time=142ms TTL=50
Reply from 1.0.0.1: bytes=32 time=140ms TTL=50The standard Comcast black-box router/modem I have has a mean ping of ~9ms, and a min of ~3ms, so yeah, I'd have to agree.
(I get ~28ms to 1.1.1.1.)
    PING 1.1.1.1 (1.1.1.1): 56 data bytes

    --- 1.1.1.1 ping statistics ---
    10 packets transmitted, 10 packets received, 0.0% packet loss
round-trip min/avg/max/stddev = 1.335/1.431/1.517/0.053 ms1.1.1.1 60 ms
8.8.8.8 20 ms
PING 1.0.0.1: 64 data bytes
--- 1.0.0.1 ping statistics ---
14 packets transmitted, 14 packets received, 0.0% packet loss round-trip min/avg/max/stddev = 120.784/126.222/128.433/2.036 ms
1.1.1.1 timed out, must be blocked by my iso.
ping 1.1.1.1: ~22ms
ping 8.8.8.8: ~19ms
dig @1.1.1.1: ~45ms
dig @8.8.8.8: ~70ms
Disclaimer: Eyeballed averages over a few samples. A more rigorous test of DNS lookup times would be cool to see.
Disclosure: I work for Cloudflare, but not on DNS.
We run a homogeneous architecture -- that is, every machine in our fleet is capable of handling every type of request. The same machines that currently handle 10% of all HTTP requests on the internet, and handle authoritative DNS for our customers, and serve the DNS F root server, are now handling recursive DNS at 1.1.1.1. These machines are not sitting idle. Moreover, this means that all of these services are drawing from the same pool of resources, which is, obviously, enormous. This service will scale easily to any plausible level of demand.
In fact, in this kind of architecture, a little-used service is actually likely to be penalized in terms of performance because it's spread so thin that it loses cache efficiency (for all kinds of caches -- CPU cache, DNS cache, etc.). More load should actually make it faster, as long as there is capacity, and there is a lot of capacity.
Meanwhile, Cloudflare is rapidly adding new locations -- 31 new locations in March alone, bringing the current total to 151. This not only adds capacity for running the service, but reduces the distance to the closest service location.
In the past I worked at Google. I don't know specifically how their DNS resolver works, but my guess is that it is backed by a small set of dedicated containers scheduled via Borg, since that's how Google does things. To be fair, they have way too many services to run them all on every machine. That said, they're pretty good at scheduling more instances as needed to cover load, so they should be fine too.
In all likelihood, what really makes the difference is the design of the storage layer. But I don't know the storage layer details for either Google's or Cloudflare's resolvers so I won't speculate on that.
This is exactly what I'm seeing with the small amount of testing I'm doing against google to compare vs cloudflare.
Sometimes google will respond in 30ms (cache hit), more often than not it has to do at least a partial lookup (160ms), and sometimes even go further to (400ms.)
The worst I'm encountering on 1.1.1.1 is around 200ms for a cache miss.
Basically, what it looks like is that google is load balancing my queries and I'm getting poor performance because of it - I'm guessing they simply need to kill some of their capacity to see increased cache hits.
Anecdotally I'm at least seeing better performance out of 1.1.1.1 than my ISP's (internode) which has consistently done better than 8.8.8.8 in the past.
Also anecdotally, my short 1-2 month trial of using systemd-resolved is now coming to a failed conclusion, I suspect I'll be going back to my pdnsd setup because it just works better.
EDIT: nevermind - mistake on my end!
Lots of network hardware (i.e., routers, firewalls if they're not outright blocking) de-prioritise ICMP (and other types of network control/testing traffic) and the likelihood is that Google (and other free DNS providers) are throttling the number of ICMP replies that they send.
They're not providing an ICMP reply service, they're providing a DNS service. I'd a situation during the week where I'd to tell one of our engineers to stop tracking 8.8.8.8 as an indicator of network availability for this reason.
1) Level3
2) DynGuide
3) UltraDNS
4) OpenDNS
5) Quad9
6) CloudFlare
7) Google
Also, no need to hardcode that address - DHCP will happily serve it up. It also has the hostname metadata.google.internal and the (disfavored for security reasons) bare short hostname metadata.
The "backup" IPv4 address is 1.0.0.1 rather than, say, 1.1.1.2, and why they needed APNIC's help to make this work
In theory you can tell other network providers "Hi, we want you to route this single special address 1.1.1.1 to us" and that would work. But in practice most of them have a rule which says "The smallest routes we care about are a /24" and 1.1.1.1 on its own is a /32. So what gets done about that is you need to route the entire /24 to make this work, and although you can put other services in that /24 if you _really_ want, they will all get routed together, including failover routing and other practices. So, it's usually best to "waste" an entire /24 on a single anycast service. Anycast is not exactly a cheap homebrew thing, so a /24 isn't _that_ much to use up.
    1.1.1.1: ~17ms (the first one took 179ms, but after that it's pretty fast)
8.8.8.8: ~16ms 8.8.8.8 - ping 7ms dig 14ms
8.8.4.4 - ping 7ms dig 16ms
1.1.1.1 - ping 7ms dig 16ms
1.0.0.1 - ping 6ms dig 15ms
9.9.9.9 - ping 6ms dig 17ms
    --- 1.1.1.1 ping statistics ---
    rtt min/avg/max/mdev = 30.507/32.155/36.020/1.419 ms

    --- 8.8.8.8 ping statistics ---
    rtt min/avg/max/mdev = 19.618/21.572/23.009/0.991 ms
edit: Namebench was broken for me, but running GRC's DNS Benchmark my ISP's own resolver is the fastest, then comes Google 8.8.8.8, then Level3 4.2.2.[123], then OpenDNS, then NTT, and then finally 1.1.1.1.
This is from my residential ADSL2 connection in Sydney:
  [Bigs-MacBook-Pro-2:~] bigiain% ping 8.8.8.8
  PING 8.8.8.8 (8.8.8.8): 56 data bytes
  64 bytes from 8.8.8.8: icmp_seq=0 ttl=59 time=21.257 ms
  64 bytes from 8.8.8.8: icmp_seq=1 ttl=59 time=25.831 ms
  64 bytes from 8.8.8.8: icmp_seq=2 ttl=59 time=22.231 ms
  64 bytes from 8.8.8.8: icmp_seq=3 ttl=59 time=21.498 ms
  ^C
  --- 8.8.8.8 ping statistics ---
  4 packets transmitted, 4 packets received, 0.0% packet loss
  round-trip min/avg/max/stddev = 21.257/22.704/25.831/1.841 ms
  [Bigs-MacBook-Pro-2:~] bigiain% ping 1.1.1.1
  PING 1.1.1.1 (1.1.1.1): 56 data bytes
  64 bytes from 1.1.1.1: icmp_seq=0 ttl=59 time=22.481 ms
  64 bytes from 1.1.1.1: icmp_seq=1 ttl=59 time=38.814 ms
  64 bytes from 1.1.1.1: icmp_seq=2 ttl=59 time=19.923 ms
  64 bytes from 1.1.1.1: icmp_seq=3 ttl=59 time=19.911 ms
  ^C
  --- 1.1.1.1 ping statistics ---
  4 packets transmitted, 4 packets received, 0.0% packet loss
  round-trip min/avg/max/stddev = 19.911/25.282/38.814/7.882 ms
  ubuntu@ip-172-31-xx-xx:~$ ping 8.8.8.8
  PING 8.8.8.8 (8.8.8.8) 56(84) bytes of data.
  64 bytes from 8.8.8.8: icmp_seq=1 ttl=55 time=2.24 ms
  64 bytes from 8.8.8.8: icmp_seq=2 ttl=55 time=2.27 ms
  64 bytes from 8.8.8.8: icmp_seq=3 ttl=55 time=2.30 ms
  64 bytes from 8.8.8.8: icmp_seq=4 ttl=55 time=2.26 ms
  64 bytes from 8.8.8.8: icmp_seq=5 ttl=55 time=2.31 ms
  64 bytes from 8.8.8.8: icmp_seq=6 ttl=55 time=2.25 ms
  ^C
  --- 8.8.8.8 ping statistics ---
  6 packets transmitted, 6 received, 0% packet loss, time 5007ms
  rtt min/avg/max/mdev = 2.244/2.274/2.310/0.066 ms
  ubuntu@ip-172-31-xx-xx:~$ ping 1.1.1.1
  PING 1.1.1.1 (1.1.1.1) 56(84) bytes of data.
  64 bytes from 1.1.1.1: icmp_seq=1 ttl=55 time=1.03 ms
  64 bytes from 1.1.1.1: icmp_seq=2 ttl=55 time=1.05 ms
  64 bytes from 1.1.1.1: icmp_seq=3 ttl=55 time=1.05 ms
  64 bytes from 1.1.1.1: icmp_seq=4 ttl=55 time=1.01 ms
  64 bytes from 1.1.1.1: icmp_seq=5 ttl=55 time=1.07 ms
  ^C
  --- 1.1.1.1 ping statistics ---
  5 packets transmitted, 5 received, 0% packet loss, time 4004ms
rtt min/avg/max/mdev = 1.015/1.046/1.076/0.035 msCloudflare:
Reply from 1.0.0.1: bytes=32 time=119ms TTL=56
Reply from 1.0.0.1: bytes=32 time=74ms TTL=56
Reply from 1.0.0.1: bytes=32 time=74ms TTL=56
Reply from 1.0.0.1: bytes=32 time=74ms TTL=56
Reply from 1.0.0.1: bytes=32 time=74ms TTL=56
GoogleDNS:
Reply from 8.8.8.8: bytes=32 time=44ms TTL=55
Reply from 8.8.8.8: bytes=32 time=43ms TTL=55
Reply from 8.8.8.8: bytes=32 time=43ms TTL=55
Reply from 8.8.8.8: bytes=32 time=43ms TTL=55
Reply from 8.8.8.8: bytes=32 time=44ms TTL=55
Pinging 1.1.1.1 with 32 bytes of data: Reply from 1.1.1.1: bytes=32 time=45ms TTL=53 Reply from 1.1.1.1: bytes=32 time=45ms TTL=53 Reply from 1.1.1.1: bytes=32 time=45ms TTL=53 Reply from 1.1.1.1: bytes=32 time=45ms TTL=53
Ping statistics for 1.1.1.1: Packets: Sent = 4, Received = 4, Lost = 0 (0% loss), Approximate round trip times in milli-seconds: Minimum = 45ms, Maximum = 45ms, Average = 45ms
Pinging 1.0.0.1 with 32 bytes of data: Reply from 1.0.0.1: bytes=32 time=46ms TTL=54 Reply from 1.0.0.1: bytes=32 time=46ms TTL=54 Reply from 1.0.0.1: bytes=32 time=46ms TTL=54 Reply from 1.0.0.1: bytes=32 time=46ms TTL=54
Ping statistics for 1.0.0.1: Packets: Sent = 4, Received = 4, Lost = 0 (0% loss), Approximate round trip times in milli-seconds: Minimum = 46ms, Maximum = 46ms, Average = 46ms
Pinging 8.8.4.4 with 32 bytes of data: Reply from 8.8.4.4: bytes=32 time=29ms TTL=56 Reply from 8.8.4.4: bytes=32 time=29ms TTL=56 Reply from 8.8.4.4: bytes=32 time=29ms TTL=56 Reply from 8.8.4.4: bytes=32 time=29ms TTL=56
Ping statistics for 8.8.4.4: Packets: Sent = 4, Received = 4, Lost = 0 (0% loss), Approximate round trip times in milli-seconds: Minimum = 29ms, Maximum = 29ms, Average = 29ms
Pinging 8.8.8.8 with 32 bytes of data: Reply from 8.8.8.8: bytes=32 time=21ms TTL=56 Reply from 8.8.8.8: bytes=32 time=21ms TTL=56 Reply from 8.8.8.8: bytes=32 time=21ms TTL=56 Reply from 8.8.8.8: bytes=32 time=21ms TTL=56
Ping statistics for 8.8.8.8: Packets: Sent = 4, Received = 4, Lost = 0 (0% loss), Approximate round trip times in milli-seconds: Minimum = 21ms, Maximum = 21ms, Average = 21ms
Pinging 208.67.220.220 with 32 bytes of data: Reply from 208.67.220.220: bytes=32 time=45ms TTL=54 Reply from 208.67.220.220: bytes=32 time=46ms TTL=54 Reply from 208.67.220.220: bytes=32 time=45ms TTL=54 Reply from 208.67.220.220: bytes=32 time=50ms TTL=54
Ping statistics for 208.67.220.220: Packets: Sent = 4, Received = 4, Lost = 0 (0% loss), Approximate round trip times in milli-seconds: Minimum = 45ms, Maximum = 50ms, Average = 46ms
Pinging 208.67.222.222 with 32 bytes of data: Reply from 208.67.222.222: bytes=32 time=61ms TTL=54 Reply from 208.67.222.222: bytes=32 time=61ms TTL=54 Reply from 208.67.222.222: bytes=32 time=61ms TTL=54 Reply from 208.67.222.222: bytes=32 time=61ms TTL=54
Ping statistics for 208.67.222.222: Packets: Sent = 4, Received = 4, Lost = 0 (0% loss), Approximate round trip times in milli-seconds: Minimum = 61ms, Maximum = 61ms, Average = 61ms
    $ ping -n 1.1.1.1
    round-trip min/avg/max/stddev = 16.696/18.643/22.571/2.056 ms

    $ ping -n 8.8.8.8
round-trip min/avg/max/stddev = 38.410/45.663/57.684/8.075 msI would be interested to hear from google (8.8.8.8) how much ping traffic that address gets ...
I know that I will quickly ping 8.8.8.8 as a very quick and dirty test of network up ... its just faster to type than any other address I could test with.
    1.1.1.1 ~ 26ms
8.8.8.8 ~ 42ms1.1.1.1 continually timed out.
1.0.0.1 succeeded
18 packets transmitted, 18 packets received, 0.0% packet loss round-trip min/avg/max/stddev = 10.178/11.128/12.585/0.576 ms