News for hackers. Stuff that matters.
Re:Mapping the U.S. By Property Value Instead of Land Area by jbattle on Wednesday July 08, 2015 @01:41PM (#9853344)
Isn't this just the same as population density? I think there's an XKCD about this ...

https://xkcd.com/1138/

Re:Mapping the U.S. By Property Value Instead of Land Area by akgerber on Wednesday July 08, 2015 @05:05PM (#9854574)
No— the coasts have substantially higher property values. A cartogram scaled by population is far less dramatically distorted: http://www.esri.com/news/arcuser/0110/graphics/cartogram_3-l... The big cities of Texas and the Great Lakes regions barely show up on the property value map.
Re:Mapping the U.S. By Property Value Instead of Land Area by ticviking on Wednesday July 08, 2015 @01:46PM (#9853379)
Roughly that's all it's showing. I'd be far more interested in the cartogram of land value/population. I suspect it would do much more to show some of the oddities that I'm sure exist. (i.e. Park City where a lot of people have really expensive vacation homes for skiing and don't live there.)
Re:Mapping the U.S. By Property Value Instead of Land Area by iaw on Wednesday July 08, 2015 @02:13PM (#9853589)
I wonder if it should be normalized by population or population density. I think population density would show the most interesting market divergences.
Re:Mapping the U.S. By Property Value Instead of Land Area by JoeAltmaier on Wednesday July 08, 2015 @02:00PM (#9853507)
Not quite fair. Usually the xkcd syndrome is caused by plotting density of something that is intrinsic to people e.g. red hair. You end up with a heatmap of population.

Here, land prices may be higher because more people are there bidding up the prices. But its not a direct property of the individuals. So the heatmap effect is indirect.

Maybe not big point, but there it is.

Re:Mapping the U.S. By Property Value Instead of Land Area by refurb on Wednesday July 08, 2015 @02:48PM (#9853831)
This map is measuring the land value within a county. Land values are dependent on population density. It's not surprising that Manhattan has such a high value when you consider how many folks are crammed into the island.

If you create a map that was land value divided by population density it would be much more interesting.

Re:Mapping the U.S. By Property Value Instead of Land Area by vonmoltke on Wednesday July 08, 2015 @03:45PM (#9854155)
Exactly. This is making Dallas County look expensive, when in fact it is one of the most affordable major metro areas in the US.

The "elite Texas counties" the article refers to are really a figment of data representation. Sure, those counties have neighborhoods or small towns that are stupid expensive, but they are the exception. All of them are highly populous, though; all five dark red counties (Dallas, Tarrant, Harris, Travis, Bexar) are in the top-20 most populous counties in the US.

Re:Mapping the U.S. By Property Value Instead of Land Area by JoeAltmaier on Wednesday July 08, 2015 @04:57PM (#9854521)
That doesn't jibe with the map data - land prices in that county are anything but affordable, regardless of how many people live there, right?
Re:Mapping the U.S. By Property Value Instead of Land Area by vonmoltke on Wednesday July 08, 2015 @05:33PM (#9854759)
The data is purporting to show total property value, not land value. Thus, a residential tower with 400 units at $100,000 each and occupying five acres adds $40 million to the valuation. In contrast, a five-acre spread with a single mansion might only be worth $5 million. Thus, a county with more residential towers will have a higher aggregate value than a county with more luxury mansions, even though the former is much more affordable.
Re:Mapping the U.S. By Property Value Instead of Land Area by dragonwriter on Wednesday July 08, 2015 @05:04PM (#9854566)
The map shows total land price in the county. It doesn't measure anything like affordability of land (which would be measured by something like price / unit area of land) or residential affordability (which would be measured by something like price / unit area of home.)
Re:Mapping the U.S. By Property Value Instead of Land Area by JoeAltmaier on Wednesday July 08, 2015 @05:37PM (#9854773)
Got it, thanks!
Re:Mapping the U.S. By Property Value Instead of Land Area by dragonwriter on Wednesday July 08, 2015 @04:59PM (#9854533)
> This map is measuring the land value within a county. Land values are dependent on population density.

Not strictly, though population density is certainly a factor (and, since its total land value in each county, so is population, which -- as counties are not of uniform size -- is a separate concern from population density. And, probably more directly than either of those, Gross County Product.)

Re:Mapping the U.S. By Property Value Instead of Land Area by ArkyBeagle on Wednesday July 08, 2015 @10:29PM (#9855870)
Land value in general goes up with population density.
Re:Mapping the U.S. By Property Value Instead of Land Area by rmxt on Wednesday July 08, 2015 @02:06PM (#9853546)
Not to be pedantic, but I think your example is a little off the mark. Red hair isn't evenly distributed amongst all human populations. [1] A heatmap of population that would leave out most of China and India isn't quite a heatmap of population.

[1] https://en.wikipedia.org/wiki/Red_hair

Re:Mapping the U.S. By Property Value Instead of Land Area by JoeAltmaier on Wednesday July 08, 2015 @02:07PM (#9853553)
Ok, talking US maps. Not many per-person maps that would work worldwide. What do you suggest for an example?
Re:Mapping the U.S. By Property Value Instead of Land Area by jessaustin on Wednesday July 08, 2015 @02:12PM (#9853586)
Dark brown hair?
Re:Mapping the U.S. By Property Value Instead of Land Area by thaumasiotes on Wednesday July 08, 2015 @02:34PM (#9853734)
Unless you're counting hair dye, this will still leave out nearly 100% of China and India. You want brown eyes, or black hair.

Grain consumption levels should track population pretty well across the world.

Re:Mapping the U.S. By Property Value Instead of Land Area by jessaustin on Friday July 10, 2015 @12:32PM (#9864973)
Grain consumption will vary by local industry. Livestock and biofuels consume more than humans do.
Re:Mapping the U.S. By Property Value Instead of Land Area by avn2109 on Wednesday July 08, 2015 @02:14PM (#9853609)
Human height
Re:Mapping the U.S. By Property Value Instead of Land Area by judemelancon on Wednesday July 08, 2015 @02:18PM (#9853625)
One of the references http://www.economist.com/blogs/graphicdetail/2015/04/daily-c... has both. There are some differences.
Re:Mapping the U.S. By Property Value Instead of Land Area by lambdasquirrel on Wednesday July 08, 2015 @03:46PM (#9854164)
No, unless I'm mistaken, it's literally the sum value of all the bare land, not including the value of the buildings. California seems to have a third of value in the United States, and the Northeast Corridor has another third, but neither have a third of the population.

(edit: I stand corrected, but it's still notable that property value and density aren't necessarily correlated.)

Re:Mapping the U.S. By Property Value Instead of Land Area by maxerickson on Wednesday July 08, 2015 @03:57PM (#9854225)
The source article is complaining about a $100 million condo in NYC that is listed at $6 million, and it pulls the values for the rest of the country from the Census (which tends to track households more than properties), so I think it is just the opposite, it mostly reflects the value of buildings.
Re:Mapping the U.S. By Property Value Instead of Land Area by wahsd on Wednesday July 08, 2015 @02:08PM (#9853567)
I would be more interested in a weighted map that is controlled by population, which would reveal places where property values are undervalued.
Re:Mapping the U.S. By Property Value Instead of Land Area by dragonwriter on Wednesday July 08, 2015 @03:28PM (#9854056)
> I would be more interested in a weighted map that is controlled by population, which would reveal places where property values are undervalued.

Only if you assume that the "correct" value of property is determined only by population density.

Re:Mapping the U.S. By Property Value Instead of Land Area by SonicSoul on Wednesday July 08, 2015 @03:31PM (#9854072)
There are more factors that go into land valuation. A few I can think of: mean salary amount, unemployment rate, past and projected economic growth
Re:Mapping the U.S. By Property Value Instead of Land Area by JackFr on Wednesday July 08, 2015 @06:22PM (#9854991)
Also important - net household formation.
Re:Mapping the U.S. By Property Value Instead of Land Area by curun1r on Wednesday July 08, 2015 @03:08PM (#9853942)
If you follow the one of the links in the story, you'll see that one of the reasons the housing prices in NYC and SF are so high is the unwillingness of current residents to allow more construction to allow greater housing density. So, in this case, it isn't a proxy for population density since the high prices are actually a symptom of below-optimal population density.
Re:Mapping the U.S. By Property Value Instead of Land Area by dasil003 on Wednesday July 08, 2015 @03:30PM (#9854067)
That doesn't quite follow since SF and NYC are already the highest population densities in the US. The fact that the residents don't want to allow greater densities doesn't invalidate the correlation.
Re:Mapping the U.S. By Property Value Instead of Land Area by curun1r on Wednesday July 08, 2015 @07:05PM (#9855196)
Yes, it does. Demand is very different from density. The fact that one region happens to have both high density and high demand is coincidence, not correlation. For it to be a correlation, that would have to be the case in most places. Places like Mountain View, Palo Alto or even Beverly Hills and Malibu also have high demand with a much lower population density.

Also, while it's trite to say, correlation doesn't not mean causation. Being a proxy means a causal relationship, not just a correlation. XKCD was arguing against maps that indicate a causal relationship. Each of the graphs in the comic don't just correlate with population density maps, they're the same because they're visualizing a trait that has no difference based on geography. That's in no way the case in this situation.

Re:Mapping the U.S. By Property Value Instead of Land Area by cynicalkane on Wednesday July 08, 2015 @08:20PM (#9855479)
The densest part of Chicago is approximately as dense as SF, but isn't so astronomically expensive.
Re:Mapping the U.S. By Property Value Instead of Land Area by dredmorbius on Wednesday July 08, 2015 @10:39PM (#9855892)
Look up the work of Geoffrey West at the Santa Fe Institute on cities and total economic activity (which scales with land values) by population.

As you increase populations (and population densities), cities become more economically active.

http://www.nytimes.com/2010/12/19/magazine/19Urban_West-t.ht...

After two years of analysis, West and Bettencourt discovered that all of these urban variables could be described by a few exquisitely simple equations. For example, if they know the population of a metropolitan area in a given country, they can estimate, with approximately 85 percent accuracy, its average income and the dimensions of its sewer system. These are the laws, they say, that automatically emerge whenever people “agglomerate,” cramming themselves into apartment buildings and subway cars. It doesn’t matter if the place is Manhattan or Manhattan, Kan.: the urban patterns remain the same. West isn’t shy about describing the magnitude of this accomplishment. “What we found are the constants that describe every city,” he says. “I can take these laws and make precise predictions about the number of violent crimes and the surface area of roads in a city in Japan with 200,000 people. I don’t know anything about this city or even where it is or its history, but I can tell you all about it. And the reason I can do that is because every city is really the same.”

Re:Mapping the U.S. By Property Value Instead of Land Area by aflyax on Wednesday July 08, 2015 @11:32PM (#9856021)
It's related to population density. A lot more people want and try to live in NYC than Birmingham, AL. More people living and desiring to live per same square mileage ~ increased price of property.
Re:Mapping the U.S. By Property Value Instead of Land Area by dredmorbius on Wednesday July 08, 2015 @10:25PM (#9855859)
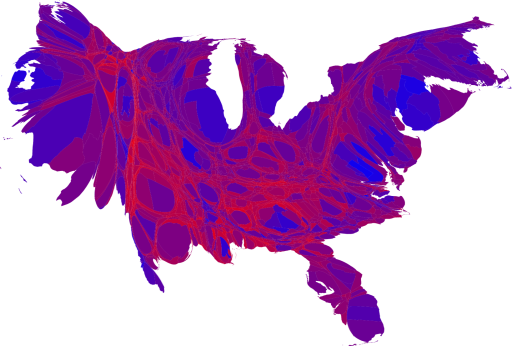
This is electoral votes per county, which is close to being population-weighted. What you'll find is that it's more moderate than the land-value cartogram, especially on the West Coast and Florida. Land values trend similarly to population densities, but actually exceed them.

http://www-personal.umich.edu/~mejn/election/2008/countycart...
Re:Mapping the U.S. By Property Value Instead of Land Area by dragonwriter on Wednesday July 08, 2015 @10:48PM (#9855919)
Electoral votes per county isn't really all that close to population-weighted; electoral votes are not apportioned proportionally to population.
Re:Mapping the U.S. By Property Value Instead of Land Area by dredmorbius on Thursday July 09, 2015 @12:43PM (#9859025)
Given that the data are by county and electoral votes aren't allocated on a county basis I'm going to walk back from what I wrote. The source isn't clear on basis though I suspect it's actually population.
Re:Mapping the U.S. By Property Value Instead of Land Area by refurb on Wednesday July 08, 2015 @11:36PM (#9856029)
It's pretty close!

Each state gets a number of electoral vote that matches the number of Representatives and Senators in their state. The senator thing throws it off a bit, but number of reps is based on population.

Re:Mapping the U.S. By Property Value Instead of Land Area by dragonwriter on Thursday July 09, 2015 @12:47AM (#9856194)
No, it's not that close. The small number of reps plus the huge variation in state sizes means that it's not particularly close even before considering the distortions from Senate seats. There is, IIRC, almost a 2:1 ratio between the maximum and minimum population-to-representative ratio among the states.
Re:Mapping the U.S. By Property Value Instead of Land Area by jschwartzi on Thursday July 09, 2015 @12:59AM (#9856224)
This used to be true because, as more population was added more Representatives would be added to the House, but as I recall it's been quite a long time since new seats were added to the House.
Re:Mapping the U.S. By Property Value Instead of Land Area by jcl on Wednesday July 08, 2015 @03:11PM (#9853959)
Not quite... If that were so, you'd expect Texas to be visibly bigger than Florida (27M vs. 20M), but their area in the distorted land value map appears to be about the same.
Re:Mapping the U.S. By Property Value Instead of Land Area by ArkyBeagle on Wednesday July 08, 2015 @10:32PM (#9855874)
Florida is much more likely to have "exiles" from more expensive regions of the Northern Atlantic Seaboard living there, driving up prices. You'll have wildly varying prices not that far apart in Florida.
Re:Mapping the U.S. By Property Value Instead of Land Area by dragonwriter on Wednesday July 08, 2015 @03:25PM (#9854042)
> Isn't this just the same as population density?

Not really, though population density is correlated with high land values, so there are obvious similarities.

Re:Mapping the U.S. By Property Value Instead of Land Area by Retric on Wednesday July 08, 2015 @04:28PM (#9854366)
No, several of the middle states have fairly large populations ex: Iowa 3+million, but disapear in this map.

PS: This is really a map of wealth * population.

Re:Mapping the U.S. By Property Value Instead of Land Area by rco8786 on Wednesday July 08, 2015 @04:30PM (#9854376)
population density.

Iowa is huge, those 3 million people are pretty spread out

Re:Mapping the U.S. By Property Value Instead of Land Area by Retric on Wednesday July 08, 2015 @04:35PM (#9854412)
https://en.wikipedia.org/wiki/Santa_Barbara_County,_Californ... only has a population density of 110/sq mi yet it's huge on that map. For comparison the 'low density' Iowa has Des Moines, Iowa with a population density of 2,515.6/sq mi.

PS: https://en.wikipedia.org/wiki/Los_Angeles_County,_California is a huge blob and only has 2,100/sq mi.

Re:Mapping the U.S. By Property Value Instead of Land Area by rco8786 on Thursday July 09, 2015 @01:58PM (#9859568)
Why are you comparing Santa Barbara county to the city of Des Moines?

Des Moines is in Polk county with a density of 751/sq mi.

Anyways, I was just pointing out that your answer of "no b/c Iowa has 3 million people" has nothing to do with population density as the question posed.

Re:Mapping the U.S. By Property Value Instead of Land Area by Retric on Thursday July 09, 2015 @02:35PM (#9859816)
Why are you comparing Santa Barbara county to the city of Des Moines?

Size on the map is calculated as the sum (property value).

If we chose Des Moines to arbitrarily be a county then its population density would be really high, but it would be an even smaller chunk on the map.

Sure, you might be able to get a reasonable approximation of that map from: population * population density per mile, but population density on its own is not going to get there.

PS: As to why I said mentioned the population of Iowa in the first place, XKCD was a map of population per area. If you scale the map based on population and ignore area then it's just a population map. http://www-personal.umich.edu/~mejn/election/2012/statepop10... Note the west coast is 1/2 the size of the east cost, and texas is about the size of california.