I nominate it for worst graph of the year: if you set out to make a biased graph, you couldn't do much better.
Drawing such an obviously bad graph undermines the point being made, in my view.
You're avoiding the distortion of inflation, but not that of starting the graph above the x axis.
The big question is will collage graduate wages rise in the future so that these debts become manageable - many are concerned they won't and these debts will consume many years of their earnings. And nobody is predicting college inflation will decline anytime soon so college may be even less affordable in the future.
BTW - Undergraduate and graduate enrollment was up only about 25% (flat since 2010)[2] while total student debt tripled since 2003. Average student debt probably nearly doubled since 2003 (up 58% 2005-2012[3] do the math to estimate 2003-2013 - up about 92%).
[1a] http://www.businessweek.com/the_thread/economicsunbound/arch...
[1b] http://theatlantic.tumblr.com/post/24693728700/dont-fall-for...
[2] http://blogs.wsj.com/economics/2013/09/03/number-of-students...
[3] http://www.forbes.com/sites/halahtouryalai/2013/01/29/more-e...
Except that's not exactly true either. The average income of newly minted college graduates has been flat or declining, but the set which is being averaged is expanding -- and expanding downwards. Unless you think that college education is the sole determinant of income, it is unreasonable to compare the "average" college graduate from 30 years ago against the "average" college graduate today -- who would very likely not have been admitted to college 30 years ago.
The same fallacy is applied in the opposite direction by colleges who are seeking to increase their student numbers: "The average graduate earns $X more than the average non-graduate." True, but it ignores the fact that the average graduate is quite different from the marginal graduate.
There must be a law of diminishing returns in education just like in almost everything else. As the opportunities to get more education have greatly expanded, the quality of both the students and that education have probably suffered. This at least partially explains the decline in the average income of college graduates. While we are probably better off as a society overall, it does mean the net benefit of education is narrowing.
And the margin is where we should focus. A basic law of decision making (in economics, business, public policy, engineering) is to always look at the marginal impact of decisions as that is where the impact will be. Unfortunately this analysis is very difficult in this case (forecasts, discounting, preferences, controls) and the results will not be very comforting: for some people, some subjects and some professions the costs will not be justified by future earnings. I don't see our society rationally acting on this kind of information. So the trend will continue or even exacerbated with more lending and subsidies. This is similar to the problems we have dealing with healthcare or global warming.
However the cost of college has increased by about 7% a year inflation-adjusted for over 30 years. This doubles the real cost every decade! Meanwhile median incomes of college graduates have been flat or declining since 2000. This clearly cannot go on forever and something that can't go on forever won't. But it is not clear to me how this will end.
My hope is that technology like MOOCs can bring down the cost of education and that incomes increase as the benefits of both that education and globalization are finally realized. Then we would have both a better educated and richer society. Alternatively more people may decide higher eduction is simply not worth it - probably resulting in negative outcomes for some. Or something more messy such as mass loan defaults and university bankruptcies resulting in even more negative outcomes. This may take a vey long time to fully play out.
For a bunch of people (myself included) bemoaning the state of analytical education in America, this is something that should be incredibly important.
A details analysis could potentially allow us to understand the magnitude of this gap but it is certainly both positive and significant. The biggest error in the graph is using total debt versus median or average debts since we know the number of students has increased. I wish he had used median debt or median cost but as I noted above both median debt and cost has roughly double over the past 10 years - so the story stands.
Part of any good analytical education should include the skill to form judgements with imperfect, incomplete and/or inaccurate data. In the real world it is very rare you have a perfect experiment that gives you perfect data. That said I agree we need better analytical education. We also need better data.
http://www.npr.org/news/graphics/2011/05/gr-avg-student-debt...

(from http://www.npr.org/2011/05/16/136214779/college-student-debt... )
EDIT: Or this maybe: http://www.worldwidehippies.com/2011/08/29/tax-breaks-for-ri...
(just doing an image search for student debt history)
And furthermore, showing the salary of college grads in isolation is useless. You need to show the delta between those with vs those w/o college degrees. If the salary of those without college degrees is falling more than those with college degrees then it still may be a prudent financial decision.
It would also be interesting to see this broken down by school. For example, I suspect that top tier public schools end up looking a lot better than bottom tier private schools.
Do note that if you look at income data a little bit closer, you will notice that people with _only_ a bachelor's degree represent roughly 20% of every income bracket, which implies there is no significance to just having a degree as it relates to income.
It is only those with post-graduate degrees who see a sharp rise in the upper income brackets. However, we tend to lump them all into a "college degree" category, which allows the latter group to bring up the numbers. Unfortunately, this leads people to believe that getting any college degree is a prudent financial decision, even though the data does not back it up.
It is worth looking at the numbers, for sure, but be careful out there. There are a lot of traps that are easy to overlook.
Incorrect:

Also, given that the Bureau of Labour is the source, do they include non-labour income sources? It seems pretty important, at least in my mind, to include all income sources. The average high school-only graduate will have $100K of potential to invest by the time someone in college graduates. Even with a low 3% interest rate, that is $3,000 in additional income for high school grads each year.
Educational Attainment by Annual Household Income:
http://content.gallup.com/origin/gallupinc/GallupSpaces/Prod...
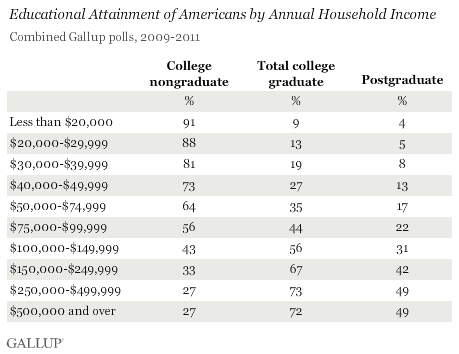
The Gallup link you provide doesn't tell you anything about causality because the relationship is backwards ("educational attainment by income"), while still providing data to refute your original argument (there's a clear positive correlation between education and wealth).
I'm not seeing it. There is very little variance except on the lowest rungs:
  <20K      5%
  20-29K    8%
  30-39K    11%
  40-49K    14%
  50-74K    18%
  75-99K    22%
  100-149K  25%
  150-249K  25%
  250-499K  24%
  500K+     23%
If bachelor's degrees and incomes had a significant correlation, you would expect a considerable increase in each income bracket like you see for the postgraduates, not just a few percentage points between them.
The only interesting correlation is with those who have post-graduate educations, but that was never disputed. It was the argument all along.
If you use the original data, instead of subtracting the columns (arbitrarily), the correlation is stronger. For both columns.
But hey, you keep arguing with facts. I have better things to do.
That's probably not the right way to look at the data -- too many weird factors (what is the distribution in the brackets, how are the brackets defined, etc...).
The best study that I've seen that breaks this out is a bit old (2002), but still probably relevant is from the US Census:
http://www.census.gov/prod/2002pubs/p23-210.pdf
It shows that over a lifetime there is a significant benefit in having a bachelors. Furthermore, having a bachelors sets you up to get further degrees later in your career.
If all it takes is a graph to convince someone "hey, this rich person is right, I should do everything they say" they see that as a very small price to pay for brainwashing.
My respect for people naturally declines when they've gone out of their way to deceive me. This happens regardless of whether or not I agree with the goal of their deception.
The Bible doesn't say 'Thou shalt only lie if it helps you further your personal agenda', it says 'Thou shalt not lie.'
Derailing, but I bet you it doesn't. :P
Median income has dropped for everybody. Household debt has increased for everybody.
Chinese peasants seem to be doing quite a bit better these days, for example.
Here's a graph for ya (stolen from elsewhere in the comments):
http://cdn.static-economist.com/sites/default/files/imagecac...
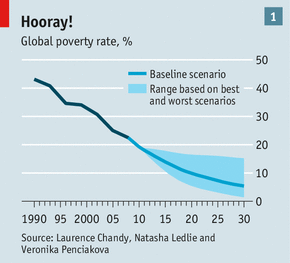
It would be interesting to know the impact of US college education on global poverty.
At any rate, it depends on the timescale. The upper quintile (and decile, and percentile) took a really huge hit in the 2008 recession, but before and since that, they've been doing a lot better than the middle deciles.
I believe the attempted claim is that "for these various populations that constitute 'everybody', their median income has dropped in each population".
So if "everybody" is these 6 guys over here ("say hi, Bob"), and you split them into 2 groups of 3 guys, and then check the median income of both groups, the claim is that both groups have a lower median income.
"In 2009 65.6% of first-time bachelor's degree recipients took out student loans, compared with 49.3% in 1994. Of those who borrowed, the cumulative amount borrowed was $24,700 in 2009, as compared with $14,700 (2009 dollars) in 1994. [...]
Among first-time bachelor's degree recipients with loans and who were employed and repaying their loans 1 year after bachelor's degree receipt, the average monthly loan repayments were 13.1% of monthly salary in 2009, as compared with 11.1% in 1994. The median monthly loan repayments were 8.0% in 2009, as compared with 6.8% in 1994.
In 2009 51.7% had monthly loan repayments that were 1-8% of their monthly salary, 17.1% had monthly loan repayments that were 9-12% of their monthly salary, 11.7% had monthly loan repayments that were 13-17% of their monthly salary, and 19.4% had monthly loan repayments that were more than 17% of their monthly salary." Source: Tables 1, 6, 7: http://nces.ed.gov/pubs2013/2013156.pdf
So basically the macroeconomic view wildly exaggerates the situation; while it is a problem that students with bachelors degrees are getting shitty jobs, the idea that it's impossible for students to get an education without outrageous monthly loan payments is just wrong. The people getting fucked over by college debt are mainly the ones who enroll in scam for-profit colleges, rack up hundreds of thousands of dollars worth of debt, and then don't graduate. Getting an actual bachelors degree is only nominally to moderately more expensive than it was 40 years ago. The fact that college graduates aren't well-educated enough to get good jobs is an enormous problem, but the idea that college is suddenly unaffordable because of cost increases is complete BS. Consider also:
"The net TFRB (tuition/room/fees/board sticker price minus total grant aid and tax benefits) at public 4-year colleges for in-state residents increased from $7,400 in 1990-91 (2012 dollars) to $12,110 in 2012-13. At private non-profit institution the net price increased from $18,330 in 1990-91 to $23,840 in 2012-13." Source: CollegeBoard - Tuition and Fee and Room and Board Charges over Time in 2012 Dollars, 1972-73 through 2012-13, Selected Years, Table 7 - Average Net Price for Full-Time Students over Time - Public Institutions, Table 8 - Average Net Price for Full-Time Students over Time - Private Institutions
"The average net tuition (tuition and fees minus all grants) in 2007-08 was $4,900 at public doctorate-granting institutions, $16,400 at private non-profit doctorate-granting institutions, and $9,200 at for-profit institutions." Source: http://nces.ed.gov/datalab/tableslibrary/viewtable.aspx?tabl... http://nces.ed.gov/datalab/tableslibrary/viewtable.aspx?tabl...
That line of thinking is also a major cultural problem. A kid learning a lot in school does not in any way either magical or practical imply the world will provide a good job upon graduation.
There is a practical concern of that which can't continue forever will not continue forever. Median incomes are permanently dropping, at least in the USA, and will continue to do so for at least a couple decades best case. Go ahead, keep raising the cost of education, see where that leads you in a supply-demand scenario where the supply of money to feed the system is permanently declining but the supply of available product is permanently increasing with substantial fixed costs. That couldn't possibly lead to a collapse in that business sector in the future, could it? The only question is how to maximally profit off it by investing at this time for the future. Now that is a hard question.
No, but if you come out of college without being functionally literate, like 69% of US college graduates, then you're pretty much guaranteed not to get a good job. C.f nces.ed.gov/NAAL/PDF/2006470.PDF
From the document: "Basic indicates skills necessary to perform simple and everyday literacy activities." That sounds like functional literacy.
In Table 8 they break out 3 different types of literacy (prose, document, quantitative).
Those with college degrees that score at Basic or above are:
Prose: 97% (with 83% being above Basic)
Document: 98% (with 87% being above Basic)
Quantitative: 96% (with 74% being above Basic)
Note, if you compare this to people with less than High School (no HS degree or GED):
Prose: 50%
Document: 55%
Quantitative: 36%
Those are not skills I personally feel qualify you for a "good job", my definition of good job being defined as one where you work with your mind. However, basic literacy does not mean you cannot be a very skilled tradesman and know a craft extremely well.
However, the majority of college graduates are intermediate or proficient. Will they all become lawyers or programmers? No. Are they functionally literate and can they perform in a workplace? Most likely, yes.
The term has an actual definition. The fact is that 'proficient' is the minimum necessary to read a newspaper article, as per their definition of 'proficient'. If you can't do that, you sure as hell can't do any sort of knowledge work.
In the above scenario the demand form the right dried up, whereas with student loans the supply from the left is going to dry up, so it's a different scenario. However, who is the equivalent of the construction companies in this scenario? My guess is the companies who supply equipment etc to universities and are over reliant on their custom. If you can find them, short them.
Well anyway that's the best I could think up. Unlike other investments, a degree is something you keep forever, so it's interesting to analyse...
- Can I ask why you defined it this way? One could very well argue that this is precisely the problem. Students are looking at "cheap" monthly payments and not looking at the actual debt amount they're accruing. Cheap interest rates for student loans may or may not go away. The total amount of debt they collect will certain not go away. So we let them get saddled with debt in the hope that historically low interest rates aren't going anywhere. Sounds familiar.
So 1 year after graduation, of students with remaining loans, the average amount owed was 20.1k, and the median monthly payment was 8.0% of salary at the same point in time. But after a year or two salary should increase substantially, so loan payments should be a much smaller percentage. And a total average remaining debt of 20.1k after one year certainly isn't ideal, but it isn't really that unreasonable either, nor should it be especially burdensome. Obviously some people are dramatically worse off than this, but for most people the system doesn't seem especially broken. But to answer your question, I think that you need to look wholistically at total net cost increases, along with total debt, along with monthly loan payments and employment statistics. Looking at any one on its own will be highly misleading. Also keep in mind that different types of institutions and degrees lead to dramatically different outcomes in all of the above. I'm really only concerned with 4-year degrees from public or private non-profit institutions, because 2-year degrees and for-profit colleges are largely scams.
The official student loan market quantity is nothing more than how much of a subsidy the .gov wants to pay off to the .edu. That doesn't necessarily imply much about the total cost of education other than its probably at least that much although it could be much more.
Depends on the particular kind of student loan.
It would be valid if it were plotted on its own or in combination with, for example, summed marginal income (the total amount of dollars those graduates made more thanks to their education == what the investment older students made brought society). Of course, that is hard/impossible to quantify and it, ideally, should be done per cohort (hard to do, as we don't even know what graduates from 2010 will make 5 years after graduation), but it would be a telling graph, I think.
Another way to show the issue in a honest way would be to estimate the number of years it takes graduates to pay back their loans. Again, hard to estimate (a student with $40,000 in income probably _could_ pay back a $20,000 debt in a year, but is it reasonable to expect that?)
And, of course, it would probably be very useful to see the combined distribution of (debt,income) pairs. If all students have a debt of 20k, and income of 40k, there is little to worry about. It is more likely, however, that both debts and incomes show large variations, and are only poorly correlated. The data set will both contain that dropout with a company worth millions, a trained neurosurgeon with 100+ k in debt that gets into an accident that invalidates his/her hand just before (s)he has the money to pay for insurance, and a talented, but a bit slow art student with limited commercial talent.
It would be more reasonable to show a per-year, per student debt (people graduating in year X had an average debt of $Y; people leaving without graduating had an average debt of $Z)
Such a graph probably still looks bad (median income has dropped, after all), but it will be more informative.