Chinese peasants seem to be doing quite a bit better these days, for example.
Here's a graph for ya (stolen from elsewhere in the comments):
http://cdn.static-economist.com/sites/default/files/imagecac...
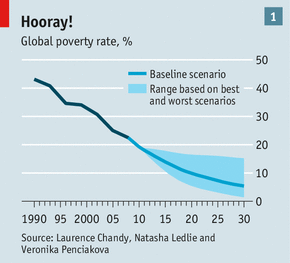
It would be interesting to know the impact of US college education on global poverty.
At any rate, it depends on the timescale. The upper quintile (and decile, and percentile) took a really huge hit in the 2008 recession, but before and since that, they've been doing a lot better than the middle deciles.
I believe the attempted claim is that "for these various populations that constitute 'everybody', their median income has dropped in each population".
So if "everybody" is these 6 guys over here ("say hi, Bob"), and you split them into 2 groups of 3 guys, and then check the median income of both groups, the claim is that both groups have a lower median income.
Median income has dropped for everybody. Household debt has increased for everybody.