Hard to get wrong, tedious to type and a huge speed increase to visually scan the output.
Most of us aren't Brian Kernighan or Rob Pike.
I am very happy for people who are, but I am firmly at a grug level.
I insist that my students learn a visual debugger in my classes for this reason: what the "stack" really is, how a loop really executes, etc.
It doesn't replace thinking & print debugging, but it complements them both when done properly.
It's useful for a beginner e.g in a for loop to see how `i` changes at the end of the loop. And similarly with return values of functions and so on.
Perhaps been underappreciating the gap in mental intuition of the runtime between then and now and how much the debugger helped to bridge.
He said that him and Brian K would pair while debugging. As Rob Pike told it, he would often drive the computer, putting in print statements, rerunning the program and so on. Brian Kernighan would stand behind him and quietly just think about the bug and the output the program was generating. Apparently Brian K would often just - after being silent for awhile - say "oh, I think the bug is in this function, on this line" and sure enough, there it was. Apparently it happened so often enough that he thought Brian might have figured out more bugs than Rob did, even without his hands touching the keyboard.
Personally I love a good debugger. But I still think about that from time to time. There's a good chance I should step away from the computer more often and just contemplate it.
My guess is that:
- Debuggers are most useful when you have a very poor understanding of the problem domain. Maybe you just joined a new company or are exploring an area of the code for the first time. In that case you can pick up a lot of information quickly with a debugger.
- Print debugging is most useful when you understand the code quite well, and are pretty sure you've got an idea of where the problem lies. In that case, a few judicious print statements can quickly illuminate things and get you back to what you were doing.
Most people who work on crud services do not see any benefit from it, as there is practically nothing going on. Observing input, outputs and databases is usually enough, and when it's not a well placed log will suffice. Debuggers will also not help you in distributed environments, which are quite common with microservices.
The only real issue in debugging a distributed/multithreaded environment is that frequently there is a timeout somewhere that is going to kill one of the threads that you may have wanted to continue stepping through after debugging a different thread.
1. When you get a stack trace from a failure, without knowing anything else find the right level and make sure it has sensible error handling and reporting.
1a. If the bug is reproduced but the program experiences no failure & associated stack trace, change the logic such that if this bug occurs then there is a failure and a stack trace.
1b. If the failure is already appropriately handled but too high up or relevant details are missing, fix that by adding handling at a lower level, etc.
That is the first step, you make the program fail politely to the user and allow through some debug option recover/report enough state to explain what happened (likely with a combination of logging, stack trace, possibly app-specific state).
Often it can also be the last step, because you can now dogfood that very error handling to solve this issue along with any other future issue that may bubble up to that level.
If it is not enough you may have to resort to debugging anyway, but the goal is to make changes that long-term make the use of either debuggers or print statements unnecessary in the first place, ideally even before the actual fix.
In my case (a digital audio workstation), a debugger can be handy for figuring out stuff in the GUI code, but the "backend" code is essentially a single calltree that is executed up to a thousands times a second. The debugger just isn't much use there; debug print statements tend to be more valuable, especially if a problem would require two breakpoints to understand. For audio stuff, the first breakpoint will often break your connection to the hardware because of the time delay.
Being able to print stacktraces from inside the code is also immensely valuable, and when I am debugging, I use this a lot.
But the debugger is essential for all the hard stuff. I’ll take heap snapshots and live inside lldb for days tracking down memory alignment issues. And print statements can be either counterproductive at best, or completely nonexistent in embedded or GPU bound compute.
- John Carmack loves debuggers
- Debuggers are most useful when you have a very poor understanding of the problem domain
John Carmack knows his domain very well. He knows what he expects to see. The debugger gives him insight into what “other” developers are doing without having to modify their code.
For Carmack, managing the code of others the debug environment is their safe space. For Kernighan et al in the role of progenitorous developer it is the code itself that is the safe space.
When I'm unfamiliar with a codebase, or unfamiliar with a particular corner of the code, I find myself reaching for console debugging. Its a bit of a scattershot approach, I don't know what I'm looking for so I console log variables in the vicinity.
Once I know a codebase I want to debug line by line, walking through to see where the execution deviates from what I expected. I very frequently lean on conditional breakpoints - I know I can skip breaks until a certain condition is met, at which point I need to see exactly what goes wrong.
In scripting languages print debugging makes sense especially when debugging a distributed system.
Also logging works better than breaking when debugging multithreading issues imo.
I use both methods.
If I wanna use a debugger though, now that means a full recompile to build the project without optimizations, which probably takes many minutes. And then I'll have to hope that I can reproduce the issue without optimizations.
10 minutes.
>If I wanna use a debugger though, now that means a full recompile to build the project without optimizations, which probably takes many minutes.
Typically always compile with debug support. You can debug an optimized build as well. Full recompile takes up to 45 minutes.
The largest reason to use a debugger is the time to recompile. Kinda, I actually like rr a lot and would prefer that to print debugging.
Have you tried out the Mold linker? It might speed it up significantly.
> You can debug an optimized build as well.
Eh, not really. Working with a binary where all variables are optimized out and all operators are inlined is hell.
I don't know the exact amounts of time per phase, but you might change a header file and that will of course hurt you a lot more than 1 translation unit.
> Eh, not really. Working with a binary where all variables are optimized out and all operators are inlined is hell.
Yeah, but sometimes that's life. Reading the assembly and what not to figure things out.
>That must absolutely suck to work with.
Well, you know, I also get to work on something approximately as exciting as Chromium.
Yeah, which is why I was talking about source files. I was surprised that changing 1 source file (meaning re-compiling that one source file and then re-linking the project) takes 10 minutes. If you're changing header files then yeah it's gonna take longer.
I've worked on projects where incremental linking after touching the wrong .cpp file will take several minutes... and this is after I've optimized link times from e.g. switching from BFD to Gold, whereas before it might take 30 minutes.
A full build (from e.g. touching the wrong header) is measured in hours.
And that's for a single configuration x platform combination, and I'm often the sort to work on the multi-platform abstractions, meaning I have it even worse than that.
> If I wanna use a debugger though, now that means a full recompile to build the project without optimizations
You can use debuggers on optimized builds, and in fact I use debuggers on optimized builds more frequently than I do unoptimized builds. Granted, to make sense of some of the undefined behavior heisenbugs you'll have to understand disassembly, and dig into the lower level details when the high level ones are unavailable or confused by optimization, but those are learnable skills. It's also possible to turn off optimizations on a per-module basis with pragmas, although then you're back into incremental build territory.
Sometimes, you just really do need hundreds of thousands of lines of C++ (or equivalent) ...
I use the debugger in Intellij, using breakpoints which only log some context and do not stop the current thread. I can add / remove them without recompiling. There's no interruption in my flow (thus no excuse to check HN because "compiling...")
When I show this to colleagues they think it's really cool. Then they go back to using print statements anyway /shrug
Debugging kernel module issues on AL2 on bare metal ec2 with kprint. Issue does not reproduce in qemu. It happens
This is the "it's one banana Michael, how much could it cost, ten dollars?" of tech. I don't think I've ever worked on a nontrivial C++ project that compiled in three seconds. I've worked in plenty of embedded environments where simply the download-and-reboot cycle took over a minute. Those are the places where an interactive debugger is most useful .. and also sometimes most difficult.
(at my 2000s era job a full build took over an hour, so we had a machine room of ccache+distcc to bring it down to a single digit number of minutes. Then if you needed to do a full place and route and timing analysis run that took anything up to twelve hours)
No C++ project compiles in 3 seconds, but your "change a single source file and compile+link" time is often on the order of a couple of seconds. As an example, I'm working on a project right now where a clean build takes roughly 30 seconds (thanks to recent efforts to improve header include hygiene and move stuff from headers into source files using PIMPL; it was over twice that before). However, when I changed a single source file and ran 'time ninja -C build' just now, the time to compile that one file and re-link the project took just 1.5 seconds.
I know that there are some projects which are much slower to link, I've had to deal with Chromium now and then and that takes minutes just to link. But most projects I've worked with aren't that bad.
Concurrency bugs just suck to debug sometimes.
First that visual debugging was still small and niche, probably not suited to the environment at Bell Labs at the time, given they were working with simpler hardware that might not provide an acceptable graphical environment (which can be seen as a lot of the UNIX system is oriented around the manipulation of lines of text). This is different from the workplace where most game developers, including J. Carmack were, with access to powerful graphical workstations and development tools.
Secondly there’s also a difference on the kind of work achieved: the work on UNIX systems mostly was about writing tools than big systems, favoring composition of these utilities. And indeed, I often find people working on batch tools not using visual debuggers since the integration of tools pretty much is a problem of data structure visualization (the flow being pretty linear), which is still cumbersome to do in graphical debuggers. The trend often is inverted when working on interactive systems where the main problem actually is understanding the control flow than visualizing data structures: I see a lot more of debuggers used.
Also to keep in mind that a lot of engineers today work on Linux boxes, which has yet to have acceptable graphical debuggers compared to what is offered in Visual Studio or XCode.
In any case, my suggestion is to understand both approaches and boldly use them in the right circumstance. If the need arises, be a rebel and break out the debugger or be a rebel and add some printfs - just don't weakly follow some tribal ritual.
By keep just one party to the loan, and most important, by me offering collateral to the loan in the event I do not deliver, then it keeps enforcement more honest and possible.
Furthermore, the loan contract should be written in such a way that the game is judged by the ONE TIME sales performance of the game (no microtransactions) and not qualitative milestones like features or reviews. Lastly, I would add a piece of the contract that says two years after the game is released, it becomes fully open source, similar to the terms of the BSL.
This is the fairest thing to the players, the bank, and the developer, and it lets the focus be absolutely rock solid on shipping something fun ASAP.
1) We only support Linux. 2) We only support Vulkan (or OpenGL, but I prefer Vulkan) 3) Singleplayer only. 4) Engine features: RGBA Diffuse, specular, shadow, normal/bump, emission maps for materials only. A simple triangle rasterizer with forward rendering. Support for audio, dae animations/rigs/geometry. Physics collisions through an octree and capsule and basic linear algebra. Basic first person/third person cameras. 4) As much content as possible from copyleft/free sources. Mixamo, Cgtrader, poliigon, textures.com etc. A programmer's job is to use whats out there. But, given an extra 6 months, I could also model and texture everything myself as well. I'll do all level design. 5) Dialogue written by me, voice acting through AI or vocaloid. 6) I would estimate the final code to be around 50,000 lines for everything. I can give you a breakdown if you want. All code is in C99, minspec is a ryzen 5600g, which is like $150 max these days.
Something I've missed? I've described a classic first person adventure shooter like Halo for you there. Simply let me know if I should do something else.
Back in college, we had to write a constructive geometry object renderer that used GLUT simply as a 2D canvas for a scanline-oriented triangle->trapezoid engine that roughly mirrored the capabilities of OpenGL with Phong and Gouraud shading, texture mapping, and bump mapping. It wasn't hard when each piece was broken down and spoon fed (quaternions and transformation matrices). The hardest part was creating a scene of complex object parts to model the real world programmatically.
The problem is, sometimes profilers don't identity anything in particular or unwinding things to a point where they can be fixed is actually very har. A more realistic ROI argument should include this as it is a real problem.
I think code should be reasonably fast out of the box. I'm not suggesting vectorizing everything or even taking extreme steps to avoid allocations, etc. Rather, if an algorithm can easily be O(N), don't dumbly implement an O(N^2) or O(N^24) version. If O(1) is possible, do that unless you know the numbers are going to be very small. Don't make 500 DB calls when one will do and finally, don't program by unexamined phrases - particularly those than include "evil" or "harmful" or other such adjectives.
"A debugger is how you get a view into a system that's too complicated to understand. I mean, anybody that thinks just read the code and think about it, that's an insane statement, you can't even read all the code on a big system. You have to do experiments on the system. And doing that by adding log statements, recompiling and rerunning it, is an incredibly inefficient way of doing it. I mean, yes, you can always get things done, even if you're working with stone knives and bare skins."
1. If I actually pause execution, the thing I'm trying to debug will time out some network service, at which point trying to step forward is only going to hit sad paths
2. The device I'm debugging doesn't *have* a real debugger. (Common on embedded, really common for video games. Ever triggered a breakpoint in a graphics shader?) Here I might substitute "print" for "display anything at all" but it's the same idea really.
Every debugger I've ever worked with has logpoints along with breakpoints that allow you to _dynamically_ insert "print statements" into running code without having to recompile or pollute the code with a line of code you're going to have to remember to remove. So I still think debuggers win.
But... that's where you put breakpoints and then you don't need to "single-step" through code. Takes less time to put a breakpoint then to add (and later remove) temporary print statements.
(Now if you're putting in permanent logging that makes sense, do that anyway. But that probably won't coincide with debugging print statements...)
Printf debugging gives you the full picture of an entire execution at a glance, allowing you to see time as it happened. The debugger restricts you to step through time and hold the evolution of state in your memory in exchange for giving you free access to explore the state at each point.
Occasionally that arbitrary access is useful, but more often than not it's the evolution of state that you're interested in, and printf gives you that for free.
And of course, should the problem you're debugging be throwing exceptions or crashing the app, the debugger can pause the world at that moment for you, and you get the benefit of debugging and having a "printf log" of the same execution already available.
I don't think you can achieve the same result using debuggers, they just stop you there and you have no context how you got there or what happens after.
Maybe some people just aren't good at print debugging, but usually it finds the issue faster for me, since it helps pinpointing where the issue started by giving you a timeline of events.
Edit: And you can see the result of debugger use in this article, under "Expression Complexity" he rewrote the code to be easier to see in a debugger because he wanted to see the past values. That makes the code worse just to fit a debugger, so it also has such problems. When I use a debugger I do the same, it makes the code harder to read but easier to see in a debugger.
One is finding a needle in a haystack - you have no idea when or where the bug occurred. Presumably your logging / error report didn't spit out anything useful, so you're starting from scratch. That and race conditions. Then print statements can be lovely and get you started.
Most of my debugging is a different case where I know about where in code it happened, but not why it happened, and need to know values / state. A few breakpoints before/during/after my suspected code block, add a few watches, and I get all the information I need quite quickly.
Temporary? Nah, you leave them in as debug or trace log statements. It's an investment. Shipping breakpoints to a teammate for a problem you solved three months ago is a tedious and time-consuming task.
Anyway, breakpoints are themselves quite tedious to interact with iterative problem solving. At least if you're familiar with the codebase.
That's not usually the case.
Setting conditional breakpoints, especially for things like break on all exceptions, or when the video buffer has a certain pattern, etc, is usually where the value starts to come in.
I can debug .NET application and change code live, change variable states if needed. Watch variables and all kinds of helpers like stack navigation was immensely improved since I started 15 years ago.
I can say debugging Java/.NET applications is totally different experience than using debugger from 1999.
Multi threaded apps debugging and all kinds of helpers i visual debuggers.
I just fail to see why someone would waste time putting in debug statements when they can configure debug session with conditional break points.
I tend to do both, print statements when I don't feel I want to be stepping through some cumbersome interplay of calls but diving into the debugger to step through the nitty gritty, even better when I can evaluate code in the debugger to understand the state of the data at precise points.
I don't think there's a better or worse version of doing it, you use the tool that is best for what introspection you need.
If you can detect a problematic condition and you want to know what will happen next, a debugger is a great tool.
If you can detect a problematic condition and you need to find out what caused it, it’s printf all the way.
My theory is that different types of programming encounter these two types of problems at different relative rates, and that this explains why many people strongly prefer one over the other but don’t agree on which.
> It takes less time to decide where to put print statements than to single-step to the critical section of code
Why would you ever be single-stepping? Put a break point (conditional if necessary) where you would put the print statement. The difference between a single break point and a print statement is that the break point will allow you to inspect the local variables associated with all calls in the stack trace and evaluate further expressions.
So when do you debug instead of using print statements? When you know that no matter what the outcome of your hypothesis is, that you will need to iteratively inspect details from other points up the stack. That is, when you know, from experience, that you are going to need further print statements but you don't know where they will be.
For example, one thing you wrote that jumps out at me:
> I already have a working model for the way that the code runs [...]
This is not always true. It's only true for code that I wrote or know very well. E.g. as a consultant, I often work on codebases that are new to me, and I do tend to use debuggers there more often than I use print debugging.
Although lots of other variables affect this - how much complicated state there is to get things running, how fast the "system" starts up, what language it's written in and if there are alternatives (in some situations I'll use a Jupyter Notebook for exploring the code, Clojure has its own repl-based way of doing things, etc).
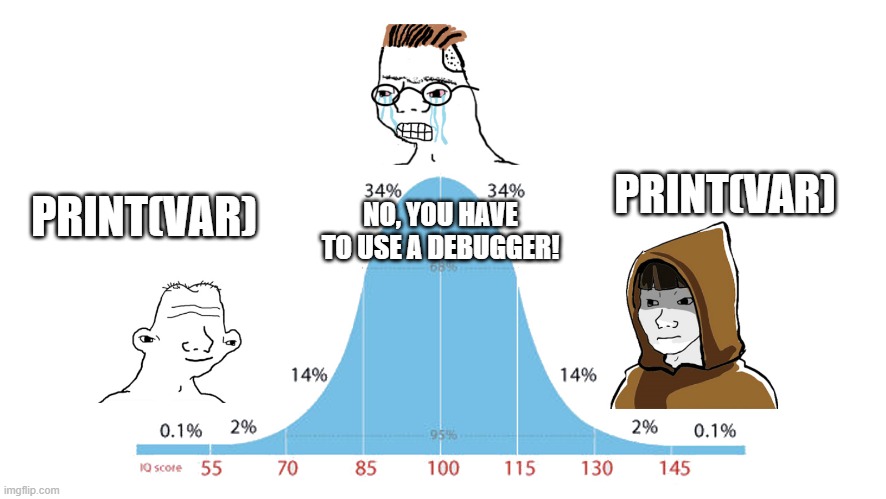
1. Printing vars in unit tests may be the fastest first approach. If i know where the bug may be.
2. When that fails i usually bring in debuggers to unit tests.
3. When these aren't helping, you need debuggers on the entire binary.
4. Still stuck? Use a debugger in production.
3. What if the binary interacts with other networked computers, you gonna debug all of them? Do you end up instrumeting the whole internet? You scope out, you spiral out of control until someone puts a limit.
However, I use prints a lot more because you can, as you say, usually get to the answer faster.
This in no way disagrees with the quote. Both can be true. The quote isn’t saying debuggers can’t provide unique insights, just that for the majority of debugging the print statement is a faster way to get what you need.
I use a debugger when I've constructed a complex process that has a large cardinally of states it could end up in. There is no possibility that I can write logic checks (tests) for all source inputs to that state.
I don't use one when I could simply increase test situations to find my logical error.
Consider the difference between a game engine and a simple state machine. The former can be complex enough to replicate many features of the real world while a simple state machine/lexer probably just needs more tests of each individual state to spot the issue.
Professional debuggers such as the one in IntelliJ IDEA are invaluable regardless of one's familiarity with a given codebase, to say otherwise is utter ignorance. Outside of logging, unless attaching a debugger is impractical, using print statements is at best wasting time.
Than what? In languages with good debugger support (see JVM/Java) it can be far quicker to click a single line to set a breakpoint, hit Debug, the inspect the values or evaluate expressions to get the runtime context you cant get from purely reading code. Print statements require rebuilding code and backing them out, so its hard to imagine that technique being faster.
I do use print debugging for languages with poor IDE/debugger support, but it is one big thing I miss when outside of Java.
> As personal choice, we tend not to use debuggers beyond getting a stack trace or the value of a variable or two. One reason is that it is easy to get lost in details of complicated data structures and control flow; we find stepping through a program less productive than thinking harder and adding output statements and self-checking code at critical places. Clicking over statements takes longer than scanning the output of judiciously-placed displays. It takes less time to decide where to put print statements than to single-step to the critical section of code, even assuming we know where that is. More important, debugging statements stay with the program; debugging sessions are transient.
I tend to agree with them on this. For almost all of the work that I do, this hypothesis-logs-exec loop gets me to the answer substantially faster. I'm not "trying to run the code forwards in my head". I already have a working model for the way that the code runs, I know what output I expect to see if the program is behaving according to that model, and I can usually quickly intuit what is actually happening based on the incorrect output from the prints.
[0] The unreasonable effectiveness of print debugging (349 points, 354 comments) April 2021 https://news.ycombinator.com/item?id=26925570