I'm not sure about the technology used at the time, but the basic answer to your question that that they had a lot more thermometers than you expect, distributed globally too. And as we're discussing global averages, the noise about +-2F in your house isn't really the same problem.
Edit: Here's a neat 100-year reanalysis paper if you're interested. Abstract link here, full pdf available on the page: http://journals.ametsoc.org/doi/abs/10.1175/BAMS-87-2-175. "Feasibility of a 100-Year Reanalysis Using Only Surface Pressure Data"
Seriously, our forecasts are nearly always wrong. So.....saying we can make as accurate of forecasts for 200 years ago...that's not really saying much.
This is after moving to two cities in the same state, more than 100 miles apart, the forecasts still never get better.
You can make fun of meteorologists if you want, but they are not wrong 95% of the time. In fact, over the last 20 years the accuracy of predictions has gone WAY up on average. There are still many places where forecasting is difficult and it's going to be a long road to improve it to get people like you to trust the forecast. But we're improving and we're making the best forecasts we've ever made in the industry.
If it came off as me trying to be down on meteorologists, that wasn't my intent, and I can't edit my original post to reflect that, so hopefully you'll see my comment here.
Meteorologists lower the quality of the data they receive.
People don't want bad news. People don't want to hear that it's going to rain on their weekend. People won't tune in to hear constant bad news.
So meteorologists take the positive and optimistic side.
The reality of forecasting is that much of the data, models, the warnings, are all created by the NWS.
The further you get from real NWS data, the lower the quality tends to be. It's like a game of telephone, except with forecasting.
National forecasters like The Weather Channel utilize tons of NWS data and models, and present it in a more friendly way. Generally there is a loss of quality here (and, when you look at TWC's buzzfeed approach to weather, it's not hard to see why they might respect clicks above all else).
Then, further down the pipe, away from the NWS and the actual source, away from National broadcasters, we get to local broadcasters. Once again, these guys are largely relying on upstream info, just packaging for the local audience.
It's not surprising that local meteorologists provide the lowest quality forecasting, because that's not really their job to provide highly accurate forecasting. Their job is actually to keep you watching through a commercial break, so the show remains on-air. The NWS is the service whose job is it to accurately forecast.
For example, just look at whatever near-term forecast you have handy. What are the forecast high and low temperatures for the next few days? What are the error bars on those highs and lows?
Oh, you couldn't find error bars? Yeah.
Where do you live? Every time I turn on the news its 90+% FUD.
It is saying quite a lot actually because the past has already happened. In the first case you are talking about the future, and yes, in some places weather is more unpredictable. You can of course move to the desert and enjoy clockwork predictable weather if it bothers you that much.
The OP was talking about "afcasting" though. In that case measurement have already been taken, but there are other records: ice cores, sea sediment, and many others. So it makes for a very interesting topic.
If your 2-3 day forecasting is off by 5-6 degrees (celcius), why would your "aftcasting" forecast for 200 years ago be any more accurate if it is "just as good" as a 2-3 day forecast? That means I would expect an error of 5-6 degrees, same as a 2-3 day forecast
edit: formatting
> For the beginning of the twentieth century, the errors of such upper-air circulation maps over the Northern Hemisphere in winter would be comparable to the 2–3-day errors of modern weather forecasts.
Might be worth reading the abstract / full paper if you're interested in the topic.
The article this discussion is linked to is claiming "1.46°F (0.81°C)" variance over recorded history. Recorded meaning they know what actually happened.
But I cannot believe that 2-3 day forecasts are accurate to within 2 degrees. Even the services linked by other commenters criticizing my original point claimed only 77% accuracy in the best case,
There are some pretty accurate forecasting services
It gets easier over longer periods of time. I may not be able to predict very well whether it's going to be 27 degrees C on July 17th 2016, but I can make a pretty good guess at the average temperature throughout the entire month, and I would be willing to put money down that it will lie within a relatively narrow band.
Also, if a meteorologist can't get the current state of the weather correct, why on earth would I trust his statement of what the temperature is going to be like? At that point I'm just going to consider it a guess.
In reality, the models are derived using different methods by different scientists.
I didn't reference centurial anything - I said that thinking it's a problem is not understanding variance. Climate scientists not only agree with me they say the same thing.
So at this point either put up some actual science or just stop JAQing off.
https://2cco2.wordpress.com/2015/08/04/the-difference-betwee...
I'd recommend at least writing a brief summary to the video if you really want to maintain an effective FAQ.
Folks have tried to get around this by finding proxies for temperature (measurements that are theorized to track temperature, like the width of tree rings for example), and then calibrating that data by comparing it with the intervals for which we have reliable data (since 1970 for satellite data, or earlier for whatever thermometer data might be suitable). The long-term trends are identified and argued based on these proxies.
So to answer your question, they can calibrate a proxy using the satellite record, see what it suggests about 1880, and combine that with the available temperature data, but that's about it.
[0] http://www.ncdc.noaa.gov/sotc/global/2015/5/supplemental/pag...
So, "useful" in the sense of "let me summarize the article in two words so you can reach your own conclusions instead of clicking that link and reading NOAA's".
Semi apologies for the snark, but yes, the first comment really was an almost informationless attempt to derail. Success!
I don't think the clarification deserved down votes.
It is important to note that we've been recording since the industrial revolution so this could be the result of human influence.

By simple random odds (which given that weather stations are few and far between, simple odds of micro-climates can shift temperature slightly), even with zero influence of global warming or any other effect, it's entirely possible to break records set over such a short period. I'm far too lazy to calculate random odds right now, but setting a new high at a 17 year interval doesn't seem remarkable. It is in the context of global warming, but in isolation it really doesn't mean much.
This isn't an anti AGW comment, and it's unfortunate that it's impossible to even state something so fundamental without it becoming religious, but the truth is that we've been recording our planet for a very short period of time, with growing accuracy and coverage every year.
Imaging we have a coin that I claim is biased. (Just pretend that front-page story about how it's impossible to bias a coin didn't happen.) I've flipped it dozens or hundreds of times and nearly every time it comes up heads.
After I've done this for a while, I start saying, check this out, I'm pretty sure this coin is biased. I provide my data to support the claim. But it's an ongoing investigation, so I'm still flipping the coin, and it keeps coming up mostly heads. Every so often I publish a confirming tidbit, like, "I just flipped the coin 5 times and every time it came up heads. This is even more confirmation that it's biased."
What you're doing is basically taking that statement and saying, that doesn't mean anything, a fair coin would produce 5 heads in a row 1 out of every 32 attempts.
Then I do another experiment, flip the coin four times and each time it's heads. Your reply is that it's meaningless because a fair coin would reproduce this 1 out of every 16 attempts.
Another experiment. Six heads. You say it's meaningless, because a fair coin would do this 1 out of 64 times.
And we keep on going. With each announcement you point out, correctly, that this specific, individual result could pretty easily occur by random chance. And yet each of your responses is useless and misguided, because it ignores all the other results.
Setting a new high is not remarkable. Doing it repeatedly starts to get more interesting. Doing it while average temperatures have been rising steadily for over a century is more compelling. Put all the data together and, while each little piece can be said to mean little because it could have happened by random chance, the sum total is highly compelling.
Do you really think you want to understand? Again, the irrational histrionics of so many to this discussion (such as the conflation of billions of years with a period of time that is a tiny, tiny sliver of human history, much less periods of the Earth). It is impossible to discuss nuances without the predictable, boorish stomping of feet and announcing of positions. People must make everyone know how firmly and strongly they believe in global warming.
And the funny thing is that I fully and completely believe in and understand AGW. It isn't a religion, however, and I'm not waving a flag or announcing fealty, or angrily posting over the top responses to anything that is other than full-fledged Belief. It is the most toxic, bottom-feeding discussion going.
You're right, the discussion is mostly awful. Climate change has been turned into a political issue, and awful discussion is a predictable result of that.
On the other hand, I don't see how your comment improves that any.
People acting outraged about a simple statement of fact like "since 1880", or the notional, obvious statement that a sporadic high or low is, by itself, not compelling, diminishes everyone.
But I'll also note that you haven't even bothered to go back and compute the probabilities in the first place.
It was one thing to make this argument in the 90's, but two decades of data later it's plainly ridiculous and it doesn't take nuanced data analysis.
https://www.ncdc.noaa.gov/sotc/service/global/glob/201506.gi...
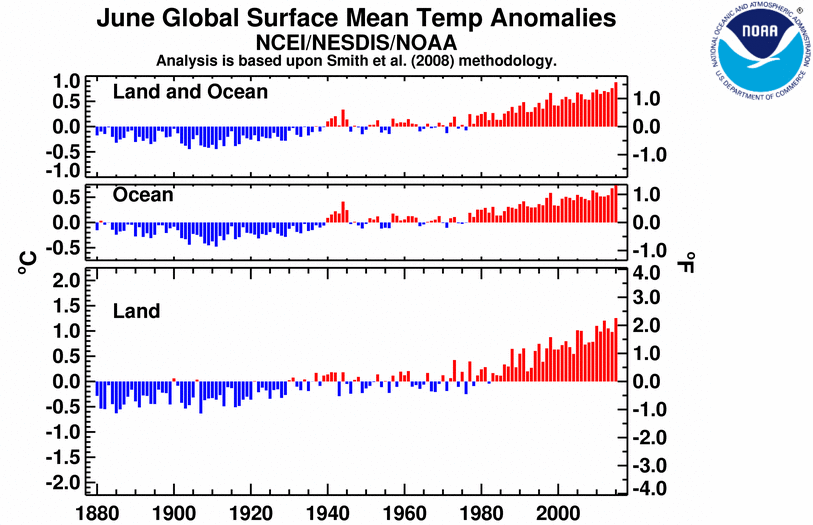
https://www.ncdc.noaa.gov/sotc/service/global/lo-hem/201506....

You're right of course, that a single record high is not compelling. Even when it's a global, monthly record high. My point in my original reply is that pointing this out is irrelevant and annoying.
Was your point merely that this data point, by itself, is not compelling? If so, my original comment, which you complained about missing the point, was exactly about that. Was it something else? If so, I'm having a seriously tough time figuring out what your point is supposed to be.
Exactly the same principle applies.
Look at the title of this submission. Stop and before you knee-jerk a response, contemplate that this isn't "it's hot, yo, and getting hotter". It is specifically that July was the hottest month "ever recorded", which someone quite rightfully noted was since 1880.
> zealots such as yourself
Stuff like this breaks the HN guidelines, and there is much of it in your comments. Please post civilly and substantively, or not at all, even when others are wrong. In fact, especially when others are wrong.
Variation at a point is high. Variation for a period of a single day is high. Samples are taken frequently. Thus new records will be set regularly.
Variation for the entire globe is low. Variation for a period of an entire month is low. There are twelve samples per year. Thus new records would not be expected to be set frequently.
Again, what exactly is your point?
For regional records, you're tracking 365 events per year. Each one is compared with that day on prior years.
For global records, you're tracking one event per year (since July will always be the warmest month).
Thus, if you'd expect to set a new record every 50 years, then you'd see on average one global record every 50 years, but you'd see about seven daily regional records every year.
Also consider that you should be seeing both record highs and record lows. Record lows continue at a good pace for regional daily records, but there hasn't been a global record low for well over a century.
AGW is reality. The disciples of AGW are profoundly intolerable, however.
Edit: I normally don't react to downvotes but this is a direct quote. Larger context: this was also the all-time highest monthly temperature in the 1880–2015 record, at 61.86°F (16.61°C), surpassing the previous record set in 1998 by 0.14°F (0.08°C)