Most people don't know/care about the statistical reality of pie charts and their lack of clarity. Maybe they are statistically proven to be bad at conveying differences in comparison to a bar graph, but if all you care about is the adoption of your charting API then you'd be a fool to not include pie charts. Sometimes being correct isn't the most important thing :)
Is this something to do with the area of circle sectors?
Re:Chart.js is back online
by DigitalJack on Tuesday March 19, 2013 @01:56PM
(#5402479)
Yes they are.
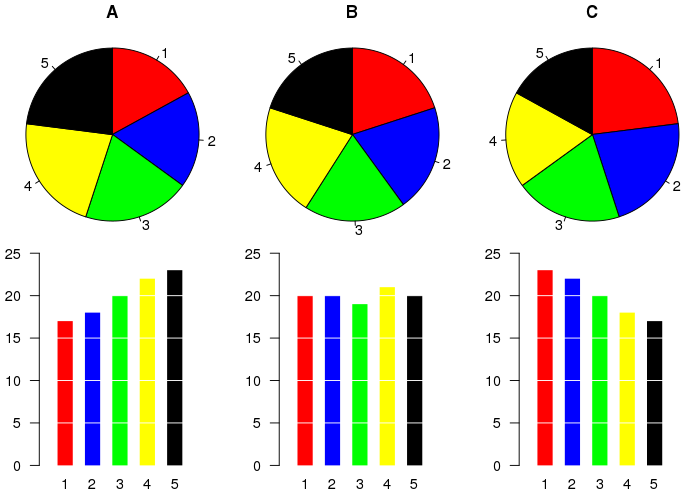
For comparing two portions they’re okay. For larger data sets it can be difficult to compare the sectors: http://upload.wikimedia.org/wikipedia/commons/thumb/b/b4/Pie...
Exactly, they're great for binary groups: <facet> yes/no
No they're not.