News for hackers. Stuff that matters.
Re:Analysis finds Australia’s inflation being driven by comp... by gruez on Friday February 24, 2023 @11:11PM (#34933812)
> In Australia businesses like supermarkets, banks, the largest airline etc. have just announced huge profits in their latest reports.

As someone who isn't from Australia, can you provide some actual figures, preferably with historical comparison? Without specifics "record profits" doesn't mean much. The most banal interpretation is that profits in nominal dollars went up, which is totally expected given that the economy grows and there's inflation, making it almost guaranteed that each year has "record profits" even if all else was equal.

Re:Analysis finds Australia’s inflation being driven by comp... by naasking on Saturday February 25, 2023 @01:03AM (#34934290)
I won't speak to Australia, but Rep. Porter did a decent job of that here:

https://youtu.be/udITRL9-t08

Re:Analysis finds Australia’s inflation being driven by comp... by gruez on Saturday February 25, 2023 @10:56AM (#34937561)
I'm not sure whether youtube is broken for me, but the linked video caps out at 480p resolution and on top of that it's letterboxed. As a result it's impossible to see what the chart is actually saying, or where the data is sourced from. Reading the transcript, the date range for the figures is "pandemic period" and "recent period", which means the comparison is probably bunk as a result of cherry picking.
Re:Analysis finds Australia’s inflation being driven by comp... by naasking on Saturday February 25, 2023 @03:19PM (#34940036)
Right, so instead of taking 5 seconds to search youtube for a better copy of this clip which is everywhere, you'll just assume your prejudice is correct? I don't know where you got your date ranges:

https://www.youtube.com/watch?v=0ixmqzjvb7k

Re:Analysis finds Australia’s inflation being driven by comp... by gruez on Saturday February 25, 2023 @04:02PM (#34940432)
>Right, so instead of taking 5 seconds to search youtube for a better copy of this clip which is everywhere, you'll just assume your prejudice is correct?

No, if the source you provided doesn't convey enough information, I'll assume that your claim is unsupported and respond accordingly. I'm not going to wade through the dumpster fire that is youtube search to try to do my opponent's work.

>I don't know where you got your date ranges:

From my previous comment:

>Reading the transcript, the date range for the figures is "pandemic period" and "recent period"

They correspond to literally the first few lines of the transcript

    0:00 according to this chart what is the
    0:02 biggest driver of inflation during the
    0:05 pandemic the blue is the dark blue is
    0:08 the recent period
>https://www.youtube.com/watch?v=0ixmqzjvb7k

I traced down the original source to be: https://files.epi.org/charts/img/248291-29919.png
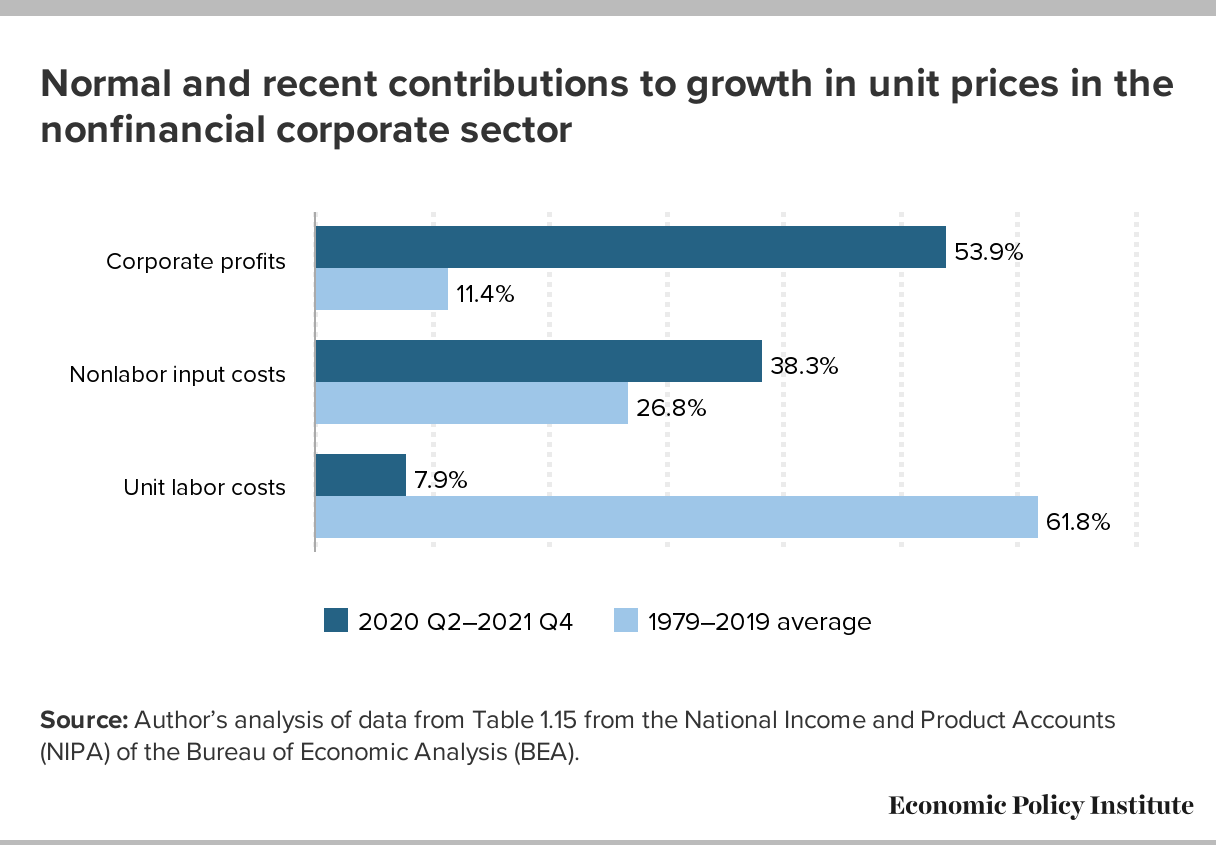
I don't see how this addresses my claim that the data was cherry picked. If anything it strengthens it.

1. the date ranges chosen for the dark blue period starts at 2020 Q2 and ends at 2021 Q4. This is an unusual date range to pick. Most analysis use round numbers and/or whole years. The start date conveniently corresponds to the trough of the pandemic recession period.

2. the date ranges chosen for the light blue period covers a 20 year period. This date period probably isn't cherry picked, but comparing long run data with short run data is inevitably going to show discrepancies, since long run data is less volatile than short run data.

Given that the BEA publishes such data on a quarter to quarter basis, they could have easily made a line chart showing the data across two decades. The fact that they chose to use a bar graph that only shows numbers for two suspiciously chosen time periods, and their overall reputation[1] makes it hard to take the chart at face value.

[1] https://en.wikipedia.org/wiki/Economic_Policy_Institute

Re:Analysis finds Australia’s inflation being driven by comp... by Khaine on Saturday February 25, 2023 @01:19AM (#34934368)
You can see Woolworth's (one of our supermarket chains) 5 half-years worth of results here https://www.woolworthsgroup.com.au/au/en/investors/our-perfo...

H23 H22 H21 H20 H19

911 798 1175 1024 1003

As you can see the 'record profit' is just coming off a low base.

Re:Analysis finds Australia’s inflation being driven by comp... by miltondts on Saturday February 25, 2023 @04:36AM (#34935279)
First, H23 is not completed. Not sure what the H23 numbers represent.

Second, looking at the profit numbers in percentage:

H19: 4.5%

H20: 5.4%

H21: 5.8%

H22: 23.9%