In other words, WASPs have a positive view of Jews, while Jews have a very negative view of WASPs.
Source: https://www.pewresearch.org/religion/2014/07/16/how-american... 2nd table
In fact, no country has a more positive view of Jews than the US (at least among those polled by Pew research): https://www.pewresearch.org/global/2008/09/17/chapter-1-view... - 2nd graph
But this sampled all US residents, not just WASPs.
On the other hand, Ivy League students are only 33% non-Jewish white, and 4-5 of the 8 presidents are Jewish, per their wikipedia pages (Martha Pollack is listed as Jewish, but the citations in support of that claim are ambiguous, hence the uncertainty), so what makes you think that admissions officers are the exception where WASPs reign?
Jews and Asians are overrepresented because they give the hard signal. Some absurd double-digit number of Asian students at Harvard have a perfect SAT score.
What's taking assessment tests out of that picture likely to do to the percentage?
It's not more WASPs, there are exactly twenty of those matriculating per year and they all drink blood out of a skull†. It's less Asians and more, heartfelt college essays about: you can fill that in, I'm sure.
†I'm not actually blood-libeling WASPs, something about how conversations have gone here recently compels me to point this out. Remember the 2004 election? Me neither.
That is why I included the SAT score in the table. Non-Jewish whites don't benefit from a higher score - they get admitted at approximately the same rates as Hispanic and Black students, despite 100-180 points higher mean SAT scores.
On the other hand, the smaller, 70 point lead of Asians gives a 6.6x higher admission rate, and the unknown lead of Jewish students a 12.8x higher admission rate. Strange, isn't it?
If you do, you probably did ok on the SAT.
Certainly not by the normal normal distribution - unless there were truly dramatic differences in the standard deviation. Do you have any evidence that there are, and are in the correct direction for your argument?
Or you could look at e.g. Harvard's own documents and see that they required higher SAT scores for whites, and highest for Asians [1]. Of course they do not count Jews separately in those figures.
[1] https://www.thecrimson.com/widget/2018/10/21/sat-by-race-gra...
Moreover, you are talking about "admission rate" which you haven't clearly defined.
Also, the normal distribution is a law of averages - that does not apply here. You have to use the actual distribution of data, not the normal distribution of averages.
If you want to make a proper statistical argument you must have the acceptance ratio at a given college for every race for a particular SAT score (say a SAT score of 1250) Any other data is just muddling signal with noise.
In fact, the paper that you linked does just that
https://www.ednc.org/wp-content/uploads/2019/08/Screenshot-2...
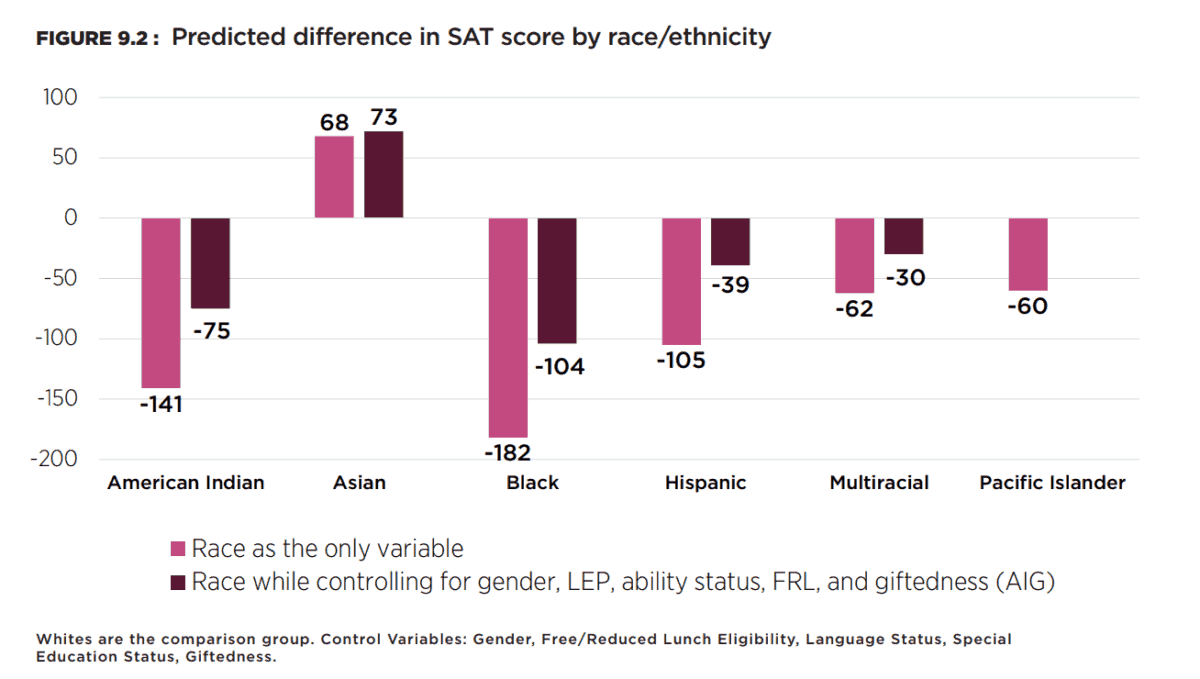
The darker bar graph us what needs to be used.
Asians most discriminated. Whites and Pacific islanders a distant second. Hispanics and multiracial follow closely at 3rd position. Blacks benefit the most, but given that the number of students in each ethnicity is not specified then the discrimination level is unclear.
If there are very few Asian students and plenty of black students, whites can be experiencing discrimination. However, if there are lots of Asians and very few black students, then whites are beneficiaries!
They could have used the average as a zero control, but they used whites, which means that definitive statements can only be made about black and Asian students!
Because each university belongs to the whole world, and none were founded to serve their country.
[1] https://www.ednc.org/eraceing-inequities-the-influence-of-ra...