Certainly not by the normal normal distribution - unless there were truly dramatic differences in the standard deviation. Do you have any evidence that there are, and are in the correct direction for your argument?
Or you could look at e.g. Harvard's own documents and see that they required higher SAT scores for whites, and highest for Asians [1]. Of course they do not count Jews separately in those figures.
[1] https://www.thecrimson.com/widget/2018/10/21/sat-by-race-gra...
Moreover, you are talking about "admission rate" which you haven't clearly defined.
Also, the normal distribution is a law of averages - that does not apply here. You have to use the actual distribution of data, not the normal distribution of averages.
If you want to make a proper statistical argument you must have the acceptance ratio at a given college for every race for a particular SAT score (say a SAT score of 1250) Any other data is just muddling signal with noise.
In fact, the paper that you linked does just that
https://www.ednc.org/wp-content/uploads/2019/08/Screenshot-2...
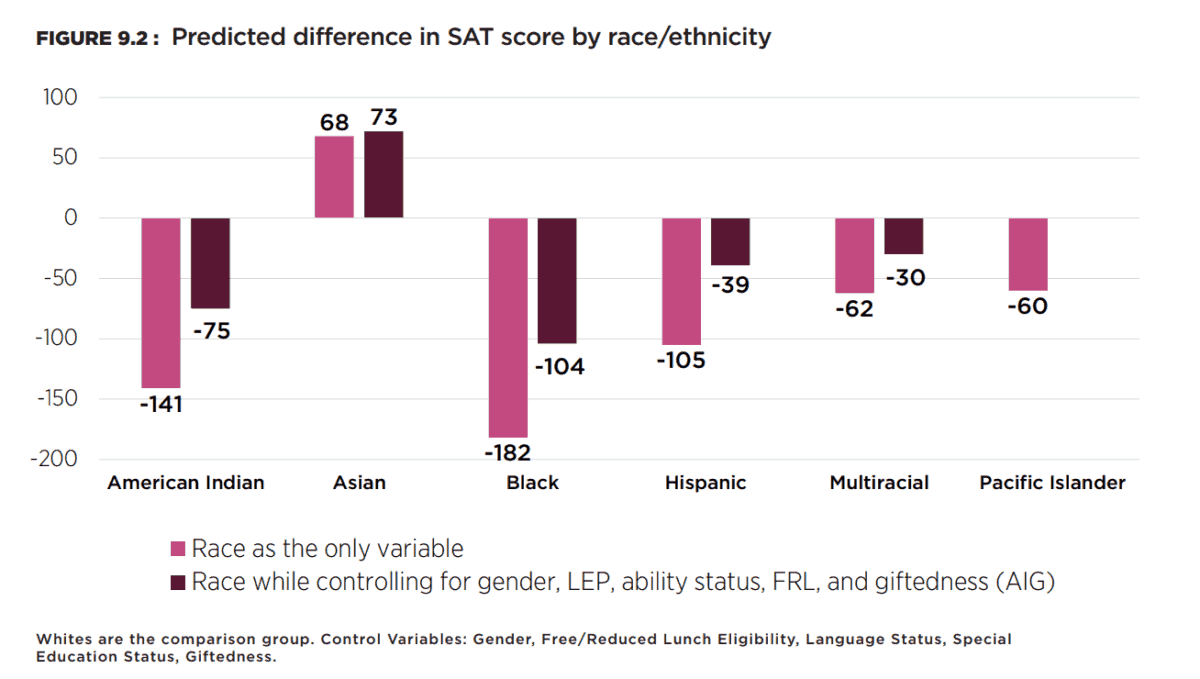
The darker bar graph us what needs to be used.
Asians most discriminated. Whites and Pacific islanders a distant second. Hispanics and multiracial follow closely at 3rd position. Blacks benefit the most, but given that the number of students in each ethnicity is not specified then the discrimination level is unclear.
If there are very few Asian students and plenty of black students, whites can be experiencing discrimination. However, if there are lots of Asians and very few black students, then whites are beneficiaries!
They could have used the average as a zero control, but they used whites, which means that definitive statements can only be made about black and Asian students!
If you do, you probably did ok on the SAT.