Sorry, but unless you're talking about truly black swan circumstances like the Great Depression or the 2008 crash, I don't believe for a second that, over a 15 year timespan, holding the S&P will result in negative returns frequently enough that a typical investor has to concern themselves with market timing.
You need to prove your work for a statement that strong.
Be sure to carefully read the description of the graph. Every time I link this, someone assumes that the green & red indicates are the yearly returns, but the entire point of this graph is that it is cumulative. If it is red 20-30 years into the line, that means that money put it at the beginning had a negative cumulative return after 20-30 years, not that the 20th or 30th year was negative. Also observe the graph is inflation adjusted.
Yes, it's true. The idea that you can just stick your money in the stock market and see 7% returns every year is somewhere between "mistaken" and "a lie". It is not a coincidence that this idea has arisen during a time of loose monetary policy and a stock market that is being inflated by it over the course of a couple of decades. In the 1970s and 1980s, for instance, this would have been considered risible, and indeed, people did not generally value stock equities. (See the chart for why they may have felt that way.)
It is not an even remotely accurate model of the stock market to think of it as a 7% return that you can casually compound over time. Anyone who speaks of that model or uses that model doesn't know what they are doing. Your debt certainly compounds over time, but your assets can't be modeled as doing that.
A couple of further observations:
Part of the reason why the stock market can offer 7-10% gains in a year, when the economy does not offer such gains in general, is precisely that "room" is made for those gains by the years in which it loses big.
This is also part of why we have a pension fund crises, because even in the relatively friendly stock market of the past couple of decades, even these so-called professionals would blindly use a high-single-digit return estimate per year, and even in the past few years, that has been an inadequate model. The bailout they're going to need if the stock market actually crashes (popping the "Everything Bubble"?) will be literally unaffordable. (Not paying in sufficiently is also a problem, but that is also itself a consequence of absurdly optimistic models being generally accepted.)
So I'll just note a few things:
1) You can clearly see the Great Depression and 2008 in here, so I'm just going to ignore those.
2) The other really nasty period for market returns was during the 70s oil crisis and subsequent high inflation period.
It also notably marks areas "slightly above inflation" as red, which are not periods where loses would occur (though, yes, the gains would be basically flat). This strikes me as an odd choice and a misleading one that makes the historical analysis look worse than it actually is.
Yet despite that, the majority of that chart shows returns moderately above inflation, sitting in at around the 4% safe withdrawal rate.
I personally don't view this as justifying the claim that individual investors need to worry about market timing. If anything it reinforces my view that they shouldn't because no one could apriori predict the kinds of events that led to the red areas of that chart.
But what's the relevance of that? When the next bubble pops, whether it be in two weeks, two years, or a decade, you and your investments are going to experience it. Some of those red splotches go on for twenty years.
As for why doing "just barely better than inflation" is marked as red, the chart accounts for inflation, but it doesn't account for a time value of money. Putting $1 dollar in the market to get $1.04 back out 30 years later is not a positive investement.
"Yet despite that, the majority of that chart shows returns moderately above inflation, sitting in at around the 4% safe withdrawal rate."
Which is why it is generally not a terrible idea to invest in the stock market.
But this is basically a goal-post move relative to the "common wisdom", which presents it as a done-deal that the stock market is always a good investment that produces a ~7% return every year. It won't matter to you that it tends to generally produce a relatively decent return over 50 years if you are currently, unbeknownst to you, at the beginning of one of those big red areas that may stretch down for decades.
Look at the stock market as it stands today. I will not tell you 100% that we are in such an area; internet commentators have predicted one million of the past 3 recessions. But I will tell you that it's an awfully plausible story.
This is not how annual returns work. If you put a $1 an average return was 4%, you will get $3.25. And if you put it in a tax deferred account or did not withdraw a lump sum after 30 years, the effect of taxes would be less dramatic.
What other investment performed better over the long time? For instance, housing did not grow much until 30 years ago.[1]
All that said, it does show that the longer you hold, the more likely you are to achieve an average positive return. Note that the only negative return (again in real terms) is the darkest red.
Again, just to drive the point home, the neutral color 3%-7% return is after inflation. If the long-run average inflation is 2%, then this is 5%-9% average annual return which almost exactly tracks the common assumptions surrounding long-term buy & hold.
This is what happens if you do all your investing in one big lump sum, e.g. putting one dollar in the market in 1970 and getting out less than a dollar (after inflation) in 1985.
Outside of getting a major windfall (and not dollar-cost averaging), this isn't how investing is done. Investments are typically made as income allows, over the course of decades. Yes, that means some of the dollars you put in are going to be massive losers in the long run. Others are going to be massive winners. What's important is the average over 30-year period of investing followed by a period of withdrawals spread out over another couple decades.
I'd be very curious to see a similar visualization which illustrates the same point for spans of time rather than lump-sum-in and lump-sum-out.
No, this is only true if its dark red.
The way you present the data of the graph does not represent how people invest. The average person works for ~40 years, so there are 40 individual years you could track on this graph. However, that isn't useful because compounding interest is a huge factor in returns. Another variable is people dont invest the same amount every year (typically people make more money as they age, however in most cases, compounding returns beat out income gains over the long term).
Consider if year one someone places $10,000 into the stock market. 40 years later, it grows into $48,000 (real value after inflation).
If you extend the diagonal boxes to 25, 30, 40, or 50 years, which makes more sense given how long people work and how long they live after retiring, the cumulative growth is _always_ above inflation.
Another think to remember is that if you are saving for retirement, you are very likely doing dollar cost averaging, i.e. making deposits on a regular basis. So you aren't buying all your stocks in one year, you are buying them across a multitude of years. That greatly mitigates the risk of starting at the wrong time.
For example, I started saving for retirement in 1999. It was ugly for a while but I was positive for good as of 2009, despite all the red in that graph.
That said I think there's some important drawbacks to point out.
First, that 7% figure that's often quoted is usually meant to mean nominal return. At least, that's the way it works relative to the commonly cited 4% SWR.
Second, buying and selling exactly once will greatly increase the variability of returns and also the likelihood of negative returns. It's important though to realize that this isn't actually how almost anyone invests, so just counting periods of negative returns under that assumption isn't particularly meaningful.
As a starting point, accept the defaults and hit "Calculate Historical Returns." The minimum return and standard deviation are most relevant.
(Note that it defaults to adjusting for inflation, but that's really the only metric that makes sense when comparing long periods, particularly those including the 1970s and 1980s, so that's probably what you want.)
My point is that investing at the peak of the market will not generate returns unless you unload before the market goes down. Now who knows if the equity markets are going to get clipped (or rather when) ... timing is fickle.
Also, selling on good years makes your performance exceptionally good.
I guess TL; DR. Either sell in the good years around nowish if you've generated a return as equity markets are frothy or be prepared to hold a long time to generate a return [statement for S&P index not individual stocks] assuming the future follows some of the past patterns (sample size is small though to be fair).
To me the takeaway isn't that "timing is critical for good returns" but that "you can't time good returns, so don't move all your money at once". You'll be investing over the years of your career and withdrawing over years of your retirement. Historically, it ends up working out.
If people planned to contribute once in their life, the risk of buying the top before a long drawdown would be relevant.
Most people spend decades of their life buying investments. Even folks with bad luck seldom buy the absolute top -- positions acquired a couple months before are out of the drawdown that much sooner.
No backtest of typical investment patterns is going to see any 15-year net losses in the S&P's history.
What about mid-2000 to late-2006?
And that's in nominal terms, because it underperformed cash from mid-2000 to mid-2013 (and quite longer against bonds).
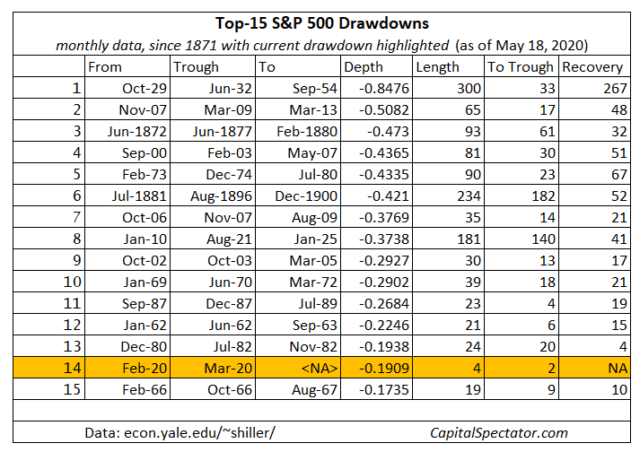
I would argue that psychologicaly the S&P offers the least optimistic promise of return for an investment a person would realistically make, since it is supposed to represent the market as a whole. People don't like to make an investment if they believe its quality is below-average, so expectation of average returns is really the minimum.
Are you certain? Are you taking into account potential deflation or other factors during that time?
There are some analyses that say that even if you bought at the height in 1929, you would actually still make you money back within 10 years. Here is an article from 2009 [1] suggesting that the very longest true downturn of the stock market was 8 years, during the recession of the 1970s.
1. https://www.nytimes.com/2009/04/26/your-money/stocks-and-bon...
Yes, timing is crucial. In your analysis, how much did timing change if you change the "sell date" into a 6 month window?
This is well captured in this guy's drawdown charts:
http://blog.nawaz.org/posts/2015/Dec/pay-down-mortgage-or-in...
Thanks in advance for your answer!
Invest the same amount of money each pay cycle. If stock is expensive, you'll be able to afford less stock, if stock is cheap, you'll afford more stock.
> Our research indicates that it's prudent to invest a lump sum immediately.
Article: https://investor.vanguard.com/investing/online-trading/inves...
PDF: https://static.twentyoverten.com/5980d16bbfb1c93238ad9c24/rJ...
My point is that holding S&P 500 generally gives you a positive return but if you buy during good years/months and end up having to sell in bad years/months you actually can have a negative return up to a about 15 years (if you really eff the timing up) or get marginal returns (1-2% per year).
Even over 40 years - you probably wouldn't be supper happy with a 100% return - yes things go positive but your returns are much lower if you time the market poorly (obvious statement).
For example buying in 98/99/00 your returns are much worse then buying before or after. Likewise selling in those years gave much higher returns.
Stating the obvious - but worth thinking about. Sell when the market is rich, buy when its soft (like blackjack).
http://archive.nytimes.com/www.nytimes.com/interactive/2011/...
Note that the light red color is actually still indicating a positive real return, this is particularly relevant in the 70s and early 80s when a 2% real return would be a much higher nominal return.
Agreed that some people expect returns for time horizons as short as 10 years though, which is clearly a mistake.
http://blog.nawaz.org/posts/2015/Dec/pay-down-mortgage-or-in...
Must be some differences in the data they have vs what I could find. I did include inflation and dividends, but not taxes - wondering if that brought it to the negative.
Timing is crucial for good returns - depending on when you put in and take out your money the returns can be negative (even in cases where you hold up to 15 years) and in other cases quite good (best cases inflation adjusted annualized returns of 12% over 40 years).
I did it because I didn't buy the commentary that you should just put it in S&P 500 and that it will almost guarantee returns.