"My cost of living has doubled but your saying everything is fine since the CPI has only gone up %3!!!" and general 'let them eat cake' style behaviors saying that iPads are 'so much cheaper'[0] is the general feeling I get.
[0] https://www.reuters.com/article/us-usa-fed-dudley-ipad/ipad-...
It’s my perception that there is not much inflation in some areas of the market (chicken thighs at Kroger) and tons for the “keeping up with the Jones’s” set (organic produce, private school education etc)
My point being that inflation can be quite different based on different baskets of goods / consumption patterns
What do you think is missing, or mis-weighted?
Ex:
https://www.macrobusiness.com.au/2017/04/excluding-housing-c...
https://www.bls.gov/cpi/tables/relative-importance/2020.htm
Housing is 42.385%, of which the shelter itself is 33.316%. The rest includes things like "Clocks, lamps, and decorator items" at 0.313%.
That's American data. Maybe the Australian data (your first link) really does exclude it, but the US most certainly does not.
If people think that the basket of goods is skewed, they need to justify that by comparing it against this list. The BLS makes a ton of data available, and it's unreasonable to claim otherwise.
This is a good visualisation of which things got cheaper and others got more expensive, over the last 20 years in the USA. It shows how a "consumer price index" in which, for example, the price of tobacco is weighted at >50% the price of education, can make it seem like it's all okay.
https://cdn.substack.com/image/fetch/f_auto,q_auto:good,fl_p...
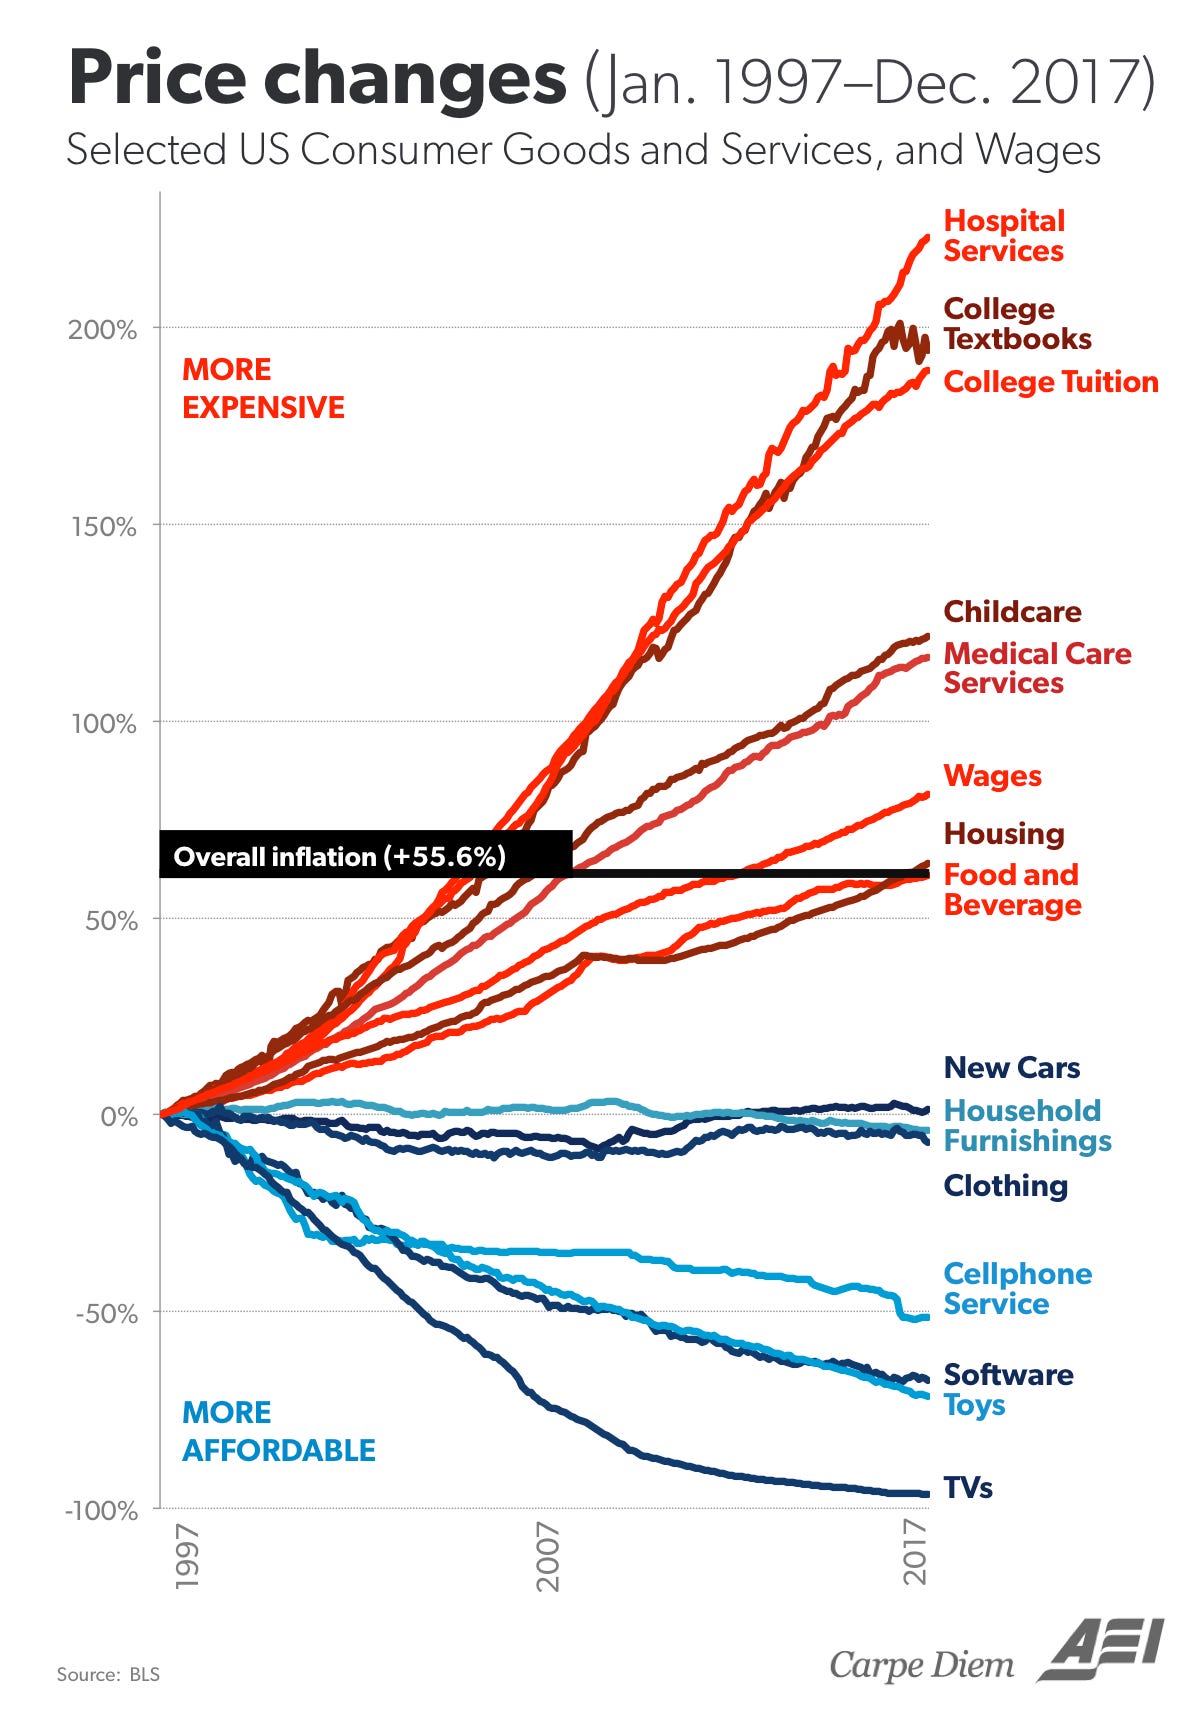
This post is also good in that it layers the hike in the price of insulin on the above graph. Be prepared to scroll.
https://insulin.substack.com/p/the-price-of-insulin-vs-the-p...
2. There are around 20mln Americans in college, versus around 34mln adult smokers. Be careful about peer-group bias: how many of your friends smoke, how many went to college?
[1] https://www.bls.gov/cpi/tables/relative-importance/2020.htm
Not an index per se but the Canadian Centre for Policy Alternatives publishes living wage reports, here is how they calculated it in the last one (2019): https://www.policyalternatives.ca/sites/default/files/upload...
My layman understanding of inflation is that it is the measure of change of purchasing power a unit of currency has over time. I think most laymen, including myself, questions how this rather theoretical concept is actually measured in real life. Eg. I think it is a sensible expectation that if inflation was said to be 2% for 20 years then I should be able to buy a house that cost $200K 20 years ago for ~$300K now. This expectation is worlds away from reality which then prompts people to question the way inflation is measured.
I know you wrote that you don't really have the inclination anymore to educate on the topic but I for one would be grateful for any pointers how to explain the above discrepancy?
Particularly if one of those is a house and in the period of time mentioned houses not only got more expensive but they changed in character, being more resistant to earthquakes because of reinforced foundations, and because the fire departments built near them got new hoses for their trucks. So if houses were the one that went up by 4% but they also increased in quality, should we "count" them as having gone up by 4%? After all it's not like your money buys you 4% less house since it actually buys you a slightly different house but for 4% more. Now multiply the number of products and dimensions by a thousand or hundred thousand each and we have the true problem of compiling CPI.
Shouldn't the solution basically be how much monthly or yearly does an average consumer spend on x good, and then that is included in the calculation of inflation by that amount.
So if the average consumer spends 30% on housing, then housing should be 30% of the measurement.
How should a measure of inflation track that?
What if Good X becomes half as expensive per unit but people consume twice as much of it as a result? Should that be reflected as a reduction of inflation? If housing per front door goes up by 100% but only up per square foot [or room] by 50%, should the inflation rate of housing be 50%, 75%, or 100%?
Excluding savings, My budget boils down to discretionary and non-discretionary spending. Roughly 1/4th of my budget is fully discretionary and will vary year to year with what I like to do, tracking inflation on the discretionary portion seems like a high difficulty activity which ultimately doesn't matter to my perception of prices.
The remaining 75% of my budget is non-discretionary covering items like
- Housing ~1/4
- Childcare ~1/4
- Food ~1/8
- Non-discretionary expenses (repairs, car, phone, computer, etc. ) ~1/8
I'm fortunate that my healthcare is inexpensive at the moment, but it's pretty straightforward to calculate my future expected health costs and my previous education costs. I'd judge that calculating inflation on the non-discretionary portion of my budget should be trivial, small items like phones/computers simply do not add up to much relative to the big ones like housing, childcare, food, health, and education.
Ironically the CPI seems to focus on the magic basket of goods and not what will actually move the needle for perceived costs by most individuals.
For example: is TV service discretionary? Is Internet service discretionary? Is broadband Internet access discretionary?
I just checked. Bell TV + Internet is advertised as $120CAD right now. Cell service combined with that add $70CAD. Per month. With taxes on top that's round about $2,620 per year if we are talking Single person household.
Now it depends on where you are and whether you live alone or not and such. In Toronto as a single person at the median income this alone can be 4.5% of your net income. I'd say that moves the needle. I pay less than half of this with a different ISP and cell provider + Netflix. Of course the precise calculations change as we move between cities and provinces as well as single person vs. families etc. as base costs get shared.
For perspective, our hypothetical individual would be experiencing house price inflation equal to a new TV, phone, and internet bill every year.
(1-bedrooms displayed the lowest price increase of any housing category in Toronto according to https://www.zumper.com/rent-research/toronto-on )
Once I have a house the inflation on that also doesn't affect me that much any more (sure, evaluations increase my tax bill - which btw is a NA thing that is irrelevant in Germany for example as long as you have a mortgage) but other items do.
1. The marginal cost of housing has little to do with what individuals pay in the short-term.
2. The median income earner requires or will require substantial subsidies or raises to keep pace with the increased costs of their home. Roughly 3-4% per year assuming that housing is the only item inflating.
3. Either the median income, median rental, or tv+internet prices we've quoted are wildly off the mark.
I'd bet that #2 is the correct interpretation of the statistics. While option 1 is possible, it hides low-quality substitutions and assumes that one can always make a substitution such as living with parents for longer.
I realize that we (or at least I am) also mixing up various things, even though I chose to quote a particular city's median income for the example.
If you are renting and your rent goes up 10% that obviously has a large effect. If you have a house and rent goes up 10% you don't care at all. If rent goes up like that, it's probable that house/condo sale prices go up too and you have to pay more in taxes. I bet the increase in taxes makes a smaller hole in your pocket, though I might be completely wrong. But this also depends on whether we stick with the example or move on to other countries, where there's no such thing as separate municipal/school taxes or where rent control is in place.
Given this, the answers to your questions should be obvious. The answer, as far as laymen are concerned, is 3.5%. Improvements don't matter either. If we eliminated every car other than a Porsche, as far as laymen are concerned then car inflation went up by around 150%.
If the answer seems obvious, then the question isn't fully understood, because there are trade-offs involved in CPI calculations.
There's no such thing as a "layman." Different people in different regions experience different CPI. Inflation for all goods in the Northeast might be 2.1% over the past ten years, but could be 1.6% in the South for the same basket. that might not sound like much, but that means that inflation is rising 25% faster in the Northeast.
No matter what you do, CPI at a national level won't accurately reflect any group. People in the South will claim it's way too high, and people in the NE will complain that it's way too low, etc, etc.
If you want real numbers, relevant to your situation, then the BLS provides the ability to calculate your own person CPI based on what you buy and where you live.
And sure, they could use something different as a measure of inflation than CPI, but what would that be, and why it would be better than CPI? These questions need to be answered first before we move away from CPI.
CPI is very important, but the labor numbers are much better (since they are easier to measure), so CPI might become a secondary (high level, target) metric over time.
The same person living in Seattle might see housing prices double since they rent, food prices explode, since they live in a gentrifying area where low-cost grocers are replaced by high-end organic ones, and gasoline might not be a huge component of their spend because they drive a beater Prius 15 miles a day.
Those are two people, buying pretty similar things who experience inflation very differently than "average." Luckily, the BLS does provide different CPI figures to account for different groups of people -- for example only looking at inflation data for Seattle -- but people generally never discuss those.
That's loosely correct; but general inflation is the change in purchasing power for currency buying final consumer goods and services, not assets which are intermediary stores of value. Purchased homes are assets (actual or foregone but using a home you own yourself) rents are consumption expenses.
> I think it is a sensible expectation that if inflation was said to be 2% for 20 years then I should be able to buy a house that cost $200K 20 years ago for ~$300K now
It's not. Specifically, that would be the fallacy of division, even if your basic understanding of inflation was correct. The change of an aggregate is not identical to the change in every subset of the aggregate.
The BLS largely circumvents this by using rents, actual rents for renters, and owner equivalent rents (OER) for owners. This is done by asking owners what they think their house would rent for, and using those increases for the housing/shelter component of CPI. Rents (which make up 1/3 of CPI) have increased faster than the general CPI, but not as much as house prices[1], likely because of the interest rate decrease.
There are some other complicating aspects around house prices (city prices increased faster than rural, houses sizes grew while household sizes shrank[3], so part of higher prices is just people buying more). But I believe the main aspects is really falling interests rates. A proper decomposition and attribution of most aspects probably takes months of work, enough for a econ Master theses. That's why I mentioned I don't have the energy for that. Nor do most other bloggers/pop-article writers, so they just go for popular appeal and clicks, by telling you why everything is getting worse and more expensive for you.
[1] https://fred.stlouisfed.org/series/MORTGAGE30US [2] https://fred.stlouisfed.org/graph/fredgraph.png?g=BLyd [3] https://azgolfhomes.com/average-home-size-u-s/

Otherwise, because rents and house prices don't always move in lockstep, it's hard to measure the buying power of a dollar over time.
When thinking about purchasing power over time or between different cities, I often think of it as "assume I'm buying 1/180th of an average house in that city each month" as part of a representative basket of goods.
1. Home prices are not captured in CPI, only rents.
2. The headline CPI is a national number. Home price inflation has actually been somewhat tame overall in recent history (2-3% per year), but it has been very geographically uneven. Some places have experienced basically no inflation, while others have tons of it.
Here is the graph for home price inflation in the San Francisco region: https://fred.stlouisfed.org/graph/?g=BLdf . You can see that it's often double digits, and certainly much higher than any headline inflation rate.
Yes, because CPI measures cost of buying service of housing. Usually, if housing prices rise, so do rents, pretty much in accord, so monitoring rents already gives you a good view on housing affordability. The extent to which cost of renting is decoupled from house prices is largely explained by changes in interest rates: lower interest rates make mortgages more affordable, which allows more bidding for houses and pushes prices up. However, this on net doesn’t do much to actual affordability of said house: at low rates, the sticker price on a house might be high, but the mortgage payments will still be low. Conversely, in the 70s and 80s, boomers saw many cheap houses on the market, but at mortgage rates of 10-12+%, these were even less affordable than houses are today.
That’s why CPI only includes rents, to make an apples-to-apples comparison.
While this would theoretically make sense, it's not actually very true in the United States. There's a significant speculative aspect to housing in some markets that results in price increases far higher than rents would sustain (this effect is actually more prominent in other markets, e.g. Canada).
Here: https://smartasset.com/mortgage/price-to-rent-ratio-in-us-ci... you can see that San Francisco prices are 50x rent, while Plano TX, which also has a high per capita income and low eviction rate, sits at 20x rent.
But it's still not obvious why for example Atlanta (22.6x) has almost double the price-to-rent ratio of Milwaukee (12.4x) if not due to speculation. Those both seem like fairly "typical America" cities to me. Would you expect Rent in Atlanta to spike heavily in the coming years? Or is the distinction you're making more about urban vs. suburban? (Since my link is just a mediocre blog, it's not clear if those numbers refer to city or metro area.)
This is literally correct, but misses the essential feature of the housing issue in CPI: A large component of the housing contribution is "owner's equivalent rent" (OER).
Last I checked (now years ago), there is a survey where BLS essentially polls homeowners with the question "How much would your house rent for?" That number is then used for the OER component of CPI.
As the housing bubble was popping, BLS felt it necessary to explain the divergence between rents and OER [1]. The statistic was an absolute mess then, and I haven't seen any reason why it got cleaned up since, although I have not followed it closely in recent years.
[1] https://www.bls.gov/osmr/research-papers/2007/pdf/ec070090.p...
Housing is a bit particular because it's a good that's almost always purchased on credit. You'd want to look at the monthly costs of housing (mortgage payment) as opposed to the sticker price, since the total cost that's affordable fluctuates based on the interest rate. Twenty years ago, the interest rate on a 30 year mortgage was about 8%, contrast it with the about 3% rates now.
>I know you wrote that you don't really have the inclination anymore to educate on the topic but I for one would be grateful for any pointers how to explain the above discrepancy?
obvious answer: it's not "price index", it's "consumer price index". First paragraph from wikipedia:
>A consumer price index measures changes in the price level of a weighted average market basket of consumer goods and services purchased by households.
Just as an example, let's say milk and eggs are the only thing on the CPI, and they're both at $2. If milk goes up to $3 and eggs go down to $1, the CPI says there was 0% inflation (assuming they don't adjust for quantity consumed). So rent can go up a lot without affecting the CPI too much, as long as the cost of other goods goes down enough to offset that increase.
Here's a graph showing inflation of different goods between 1998 and 2018: https://realinvestmentadvice.com/wp-content/uploads/2019/04/... As you can see, a lot of "mandatory" things inflated a lot, but the increase in those costs is offset by the decrease in electronics prices.
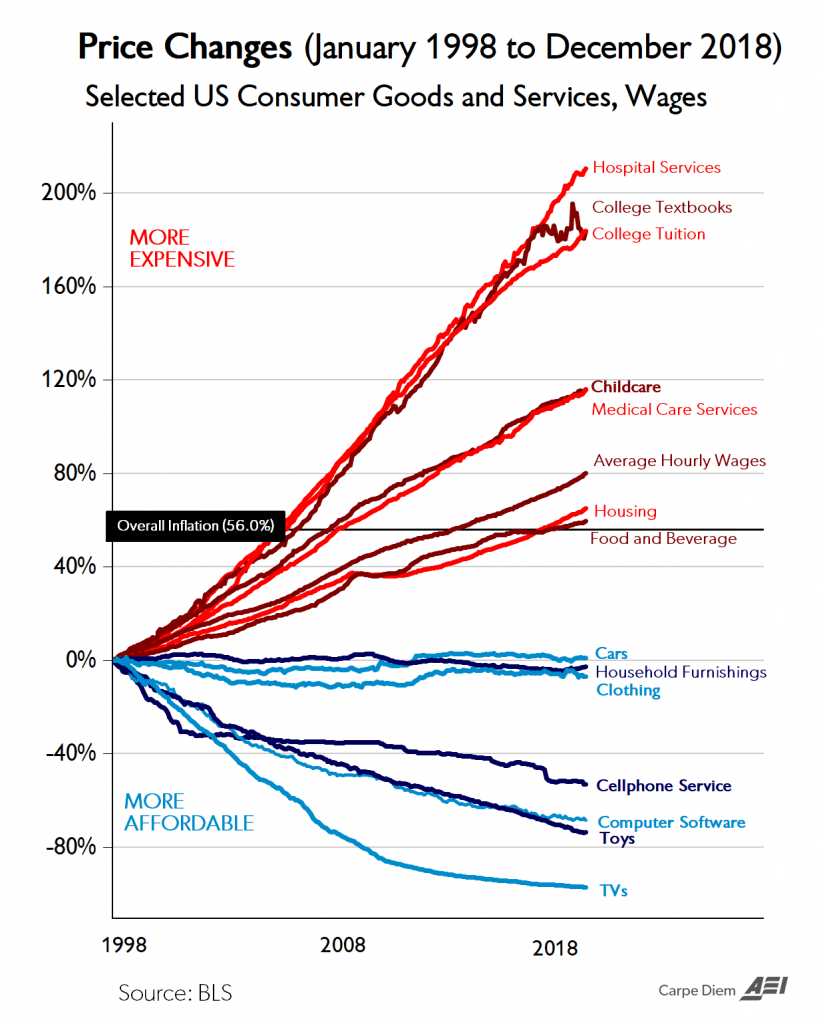
The CPI is meant, afaik, to gauge the increase in the cost of living for the "average person". It's useful for driving fiscal policy, but it's not terribly useful to laymen, imo (and that includes myself).
Houses are included in asset inflation, I believe. Here's a chart showing asset inflation: https://realinvestmentadvice.com/wp-content/uploads/2019/04/...
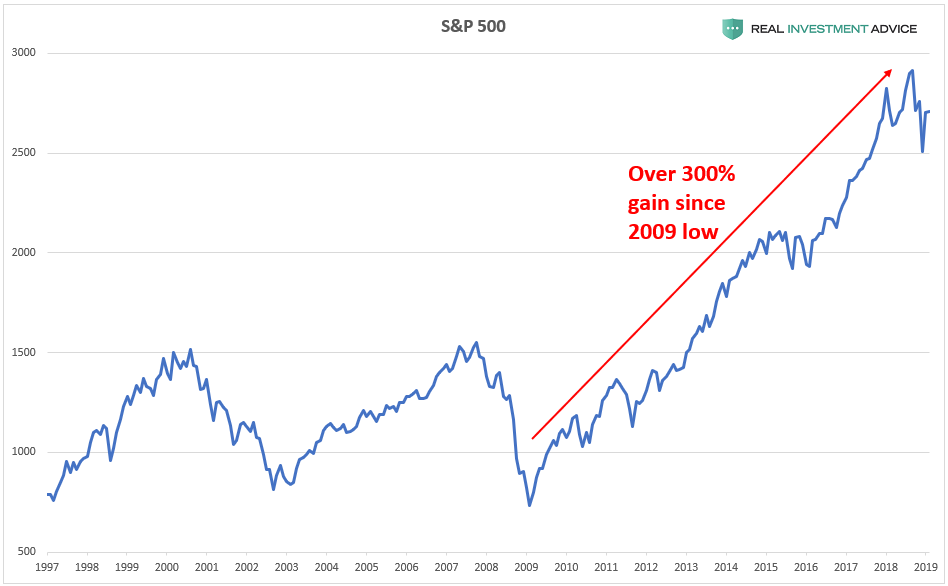
Real wages are more interesting to laymen, I think. Those are effectively wages adjusted over time based on inflation from CPI. Using your housing example again, it doesn't really matter if a house cost $200k 20 years ago and costs $400k now, as long as wages doubled over the same period, all things equal. Inflation is fine (for the purposes of buying a house) as long as wages rise to match that increase.
The reason many people can't buy houses anymore is that real wages have fallen. https://en.wikipedia.org/wiki/Real_wages Wikipedia has some interesting info on that. In an ideal world, inflation decreases the purchasing power of a dollar, but your employer gives you more of them to compensate for that. That never happened for many people.
You are missing one crucial aspect: interest rates. 20 years ago, typical interest rate was 8%, so mortgage payments on $200k house were something like $1400/mo. With today’s rate of something like 3.2%, the payments on $400k house are something like $1700/mo, which is 20% higher. To keep the affordability the same between now and then, the nominal wages need only grow 20%, and if they actually doubled, this would hugely increase affordability.
Uh no, housing is 32% of the CPI.
Source : https://arbor.com/blog/how-does-rent-factor-into-the-consume...
It doesn't track well with the experience of people on this forum because young professionals tend to live in cities with crushing rental markets, especially Silicon Valley. But the whole country, particularly thoseliving in houses not in New York or California, have a different experience.
This, of course, makes it wildly inaccurate.
All the other examples I used -- chef, journalist, writer, singer -- can win awards and recognition: Michelin stars, Pulitzer, Hugo, Nebula, Grammy, and such. Those are good indicators of their accomplishments, but that's not the same as having a set of "agreed-upon norms and standards that can be measured".
And if you decide to relax your criteria and say that having those is acceptable, then guess what? There's a Nobel Memorial Prize in Economic Sciences, and a slew of other awards for economists.
Like it or not, studying economics is something that people can and do dedicate their lives to. Would it be better if we had more clarity, transparency, and consensus when it comes to what they do? Absolutely. But dismissing the whole profession out of hand is unhelpful.
Economic theory is good for asking questions and maybe creating a standard. It has a dismal record of answering questions.
To professional economists, it can be infuriating to read (I imagine similar as medical professionals reading antivax blogs/comments, or radio engineers reading about dangers of 5G radiation).
I had a good intention once, to write layman exposition to clear most of the misconceptions. But much like the calculation of the CPI itself, it's a lot of work and ultimately not very rewarding. An unfortunate fact is that a very large part of the CPI comes from household survey responses. These are too expensive for non-professionals to reproduce and verify independently, so probably no amount of writing can really convince CPI-doubters.