I'm going to search for intimidation and see if it pops up on the map, sorry everyone
Re:Google Trends Electionland
by perfectfire on Tuesday November 08, 2016 @01:40PM
(#12902781)
I'm assuming you don't want to tell us where you live, so please update us on whether it showed up on the map or not.
Re:Google Trends Electionland
by folksinger on Tuesday November 08, 2016 @12:31PM
(#12902171)
The reports of "voter intimidation" on the electionlandstrends map matches the boundary of this racial demographic map.
http://www.censusscope.org/us/map_nhwhite.gif
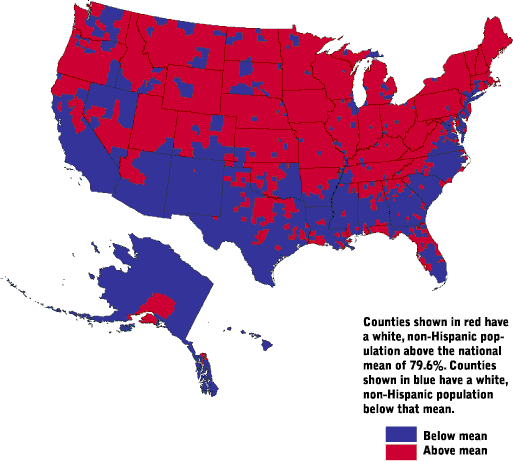
Here's those two maps combined:

Re:Google Trends Electionland
by folksinger on Tuesday November 08, 2016 @12:35PM
(#12902208)
Yeah but the maps I'm showing don't follow general population density so the point being made by this comic doesn't apply in this instance.
Unless I'm reading something on your graph incorrectly it's almost perfectly correlated with Martha Stewart Living subscribers. Looks like it applies almost exactly to me.
Re:Google Trends Electionland
by folksinger on Tuesday November 08, 2016 @01:07PM
(#12902501)
Well I already did the work I'm willing to do on my end. Further research would obviously have to take in to consideration deviations from general population density, but just looking at the map, there's a lot of voter intimidation being reported in the south that clearly has nothing to do with population density.
Also, there's no correlation with voter intimidation and population density for cities in the midwest.
So I guess it's just my word and my graph against your word and, well, nothing else. So you better get to work!
I'm not sure why you're pretending that it should be someone else's job to prove the point you're trying to make. You threw up a graph which looks identical to a population-density graph and are pretending you gave us evidence of your assertion.
Re:Google Trends Electionland
by folksinger on Tuesday November 08, 2016 @02:29PM
(#12903204)
No, I'm saying that he has to provide a better refutation of my point.
I do not agree that the graphs look identical.
What point am I trying to make, BTW?
Except your graph doesn't seem to support your point...IMO it's your word vs. your graph.
Re:Google Trends Electionland
by folksinger on Tuesday November 08, 2016 @02:36PM
(#12903265)
Prove it.
The boundary is where racial demographics are closest to the national average, are you arguing that voter intimidation is more likely in places demographically similar to average national demographics and less likely in places statistically further from the average (either higher % white people or higher % non-white people than national average)?
I'm honestly not seeing an relation there.
The problem is that both follow a very non-uniform pattern and so it's hard to even define what a "correlation" would look like.
Re:Google Trends Electionland
by thesimpsons1022 on Tuesday November 08, 2016 @12:16PM
(#12902022)
i'm searching this stuff in california. not because it's happening to me but i want to hear about the horrific things happening in north carolina and elsewhere.
How come? I would think the opposite. Voting from home absolutely applies to "voter intimidation" situations. Someone could literally be in your home with a gun to your head, making you vote the way they want you to vote.
The same problem as well as vote buying applies to online voting, too. But those are not even the biggest problems with online voting, so most people tend not to focus on them.
Re:Google Trends Electionland
by bowmessage on Tuesday November 08, 2016 @12:24PM
(#12902100)
Voting machine problems though?! There are no voting machines here.
If you dont have voting machines, it would make sense for you to google about them to understand what other voters are talking about, no?
Near Seattle there are trends reported for "voter intimidation" and "long wait times" and "voting machine problems."
Those trends make no sense for a region that votes by mail.