To make a graph, one has to make decisions, these decisions can be legitimate or they can be biased. Biased decisions lead to misleading graphs.
The same goes for other types of content such as news articles, product reviews, war photos, etc.
Edit, to illustrate better: the author of the graph chose to overlap data on a logscale (transistor count) with data on a linear scale (life expectancy). The resulting graph shows two similar curves, that suggests that the two are strongly correlated. That's what I call a biased decision.
It's not. I'd love if more people understood this clearly, it's not "statistics" that are "misleading" - it's their authors that are lying.
You can lie when speaking, you can lie in writing, and in the same way you can lie with data or with data presentation. There's no fundamental difference. Either you do your best to tell the truth, or you do your best to mislead people.
I wish people treated, on the emotional level, being presented with a misleading graph in the same way as being lied in the face in person. It should have the same social cost. If I told you a blatant lie, you would never want to have anything to do with me in your life anymore. So please, in the same way, don't trust those journalists, companies, salesmen and others, who mislead people by using statistical graphics.
Well, correlation sure DOES imply causation.
In the dictionary sense of "imply", as: "suggested but not directly expressed; implicit".
What it does not is necessitate causation, but it sure as hell does imply it.
Let me investigate this example:
the observation: Students who watch less TV have better grades.
It's not like pirates v.s. global warming, it actually makes sense at first and if you are the minister of education whose goal is to increase the grades among students and you don't have an idea about "Correlation does not imply causation" principle you may actually suggests to ban TV's to improve the education. You can even draw a fancy graph to support your idea.
However, after further investigation you may find out that this would not work because it's not the TV that is causing the lower grades. Maybe the better students tend to watch less TV because they prefer to read books instead of watching TV.
This time it may seem to suggests the opposite: Increasing the students success in school reduces the time the TV is watched. However after even further investigation you may find out that your better students are from poor families(maybe the schools in your country are accepting the best students without tuition and are not selective about these who can pay) that just don't have a TV set, or maybe these better students also need work part-time to support their families, thus they just don't have time for TV.
Thus, you can't really change one value by synthetically manipulating the other one. Turns out, the correlation did not meant causation.
http://allendowney.blogspot.com/2014/02/correlation-is-evide...
Moreover, with good enough correlation data, you can even determine the direction of casual relationship if you're willing to do a little bit of maths:
http://lesswrong.com/lw/ev3/causal_diagrams_and_causal_model...
Also, http://xkcd.com/552/ ;).
Watching TV causes worse grades.
Watching TV has no effect on grades.
Something else causes watching TV AND worse grades.
Worse grades cause watching TV.
Watching TV causes better grades.
Etc, for all the other possible correlations between these three variables.
Assume all these are equally likely. That makes it about 1/7 chance that Watching TV causes worse grades (and there is equal chance of the exact opposite.) Now the study that watching tv is correlated with worse grades comes out. You can eliminate all but the first few hypotheses that predicted the correlation. Now the hypothesis "watching TV causes worse grades" has a probability of 1/3. Almost twice as likely. And the hypothesis that watching TV has any positive effect on grades has been completely eliminated.
This is why I'm bothered when people say "correlation doesn't imply causation!!!". No it doesn't, but it significantly raises the probability. If the other hypotheses aren't that likely to begin with (i.e. "cancer causes cellphones") then it should really bring that hypothesis to your attention.
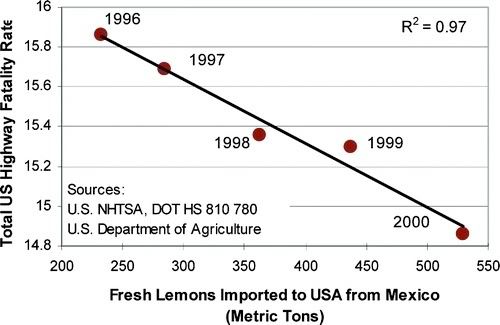

What do you mean, satirical? There's a religion founded on this image alone!

There is a famous satirical version of this too: http://en.wikipedia.org/wiki/File:PiratesVsTemp(en).svg
It has nothing to do with graphs, graphs are are just visual tools and people reading data from them are supposed to evaluate it just like reading data from any other tool and not jump into conclusions.
What the graph in question suggests is that both "transistor count" and "average life expectancy in germany" have risen trough time and if you are reading this as "rising transistor count increases life expectancy" it's your fault. Why not read it like "from 1971 to 2011 both transistor count and life expectancy increased steadily, maybe because of the advances in technology - we should look into it, it's too early to say anything"