Re:FreeBSD/EC2 boot performance over time
by cperciva on Tuesday October 15, 2024 @08:14PM
(#41854404)
Seconds, yes. Sorry I figured that was obvious, I'll add it to the graphs I generate next week.
[ Parent
| on HN ]
Re:FreeBSD/EC2 boot performance over time
by pushupentry1219 on Tuesday October 15, 2024 @08:32PM
(#41854511)
Thank you! Was about to ask for axis labels as well. I assumed seconds but I had some doubts because there were no labels!
Re:FreeBSD/EC2 boot performance over time
by defrost on Tuesday October 15, 2024 @09:43PM
(#41854839)
Good to hear.
Seconds was my best guess .. but that doesn't make it certain for the viewer.
No real drama, but FWiW I've looked at a lot of data across engineering, math, geophysics, mining, energy, etc and unlabeled data and graphs are a major annoyance.
Re:FreeBSD/EC2 boot performance over time
by amiga386 on Tuesday October 15, 2024 @10:00PM
(#41854917)
If you're taking requests, then can the Y axis start at zero, please?
https://handsondataviz.org/images/14-detect/gdp-baseline-mer...
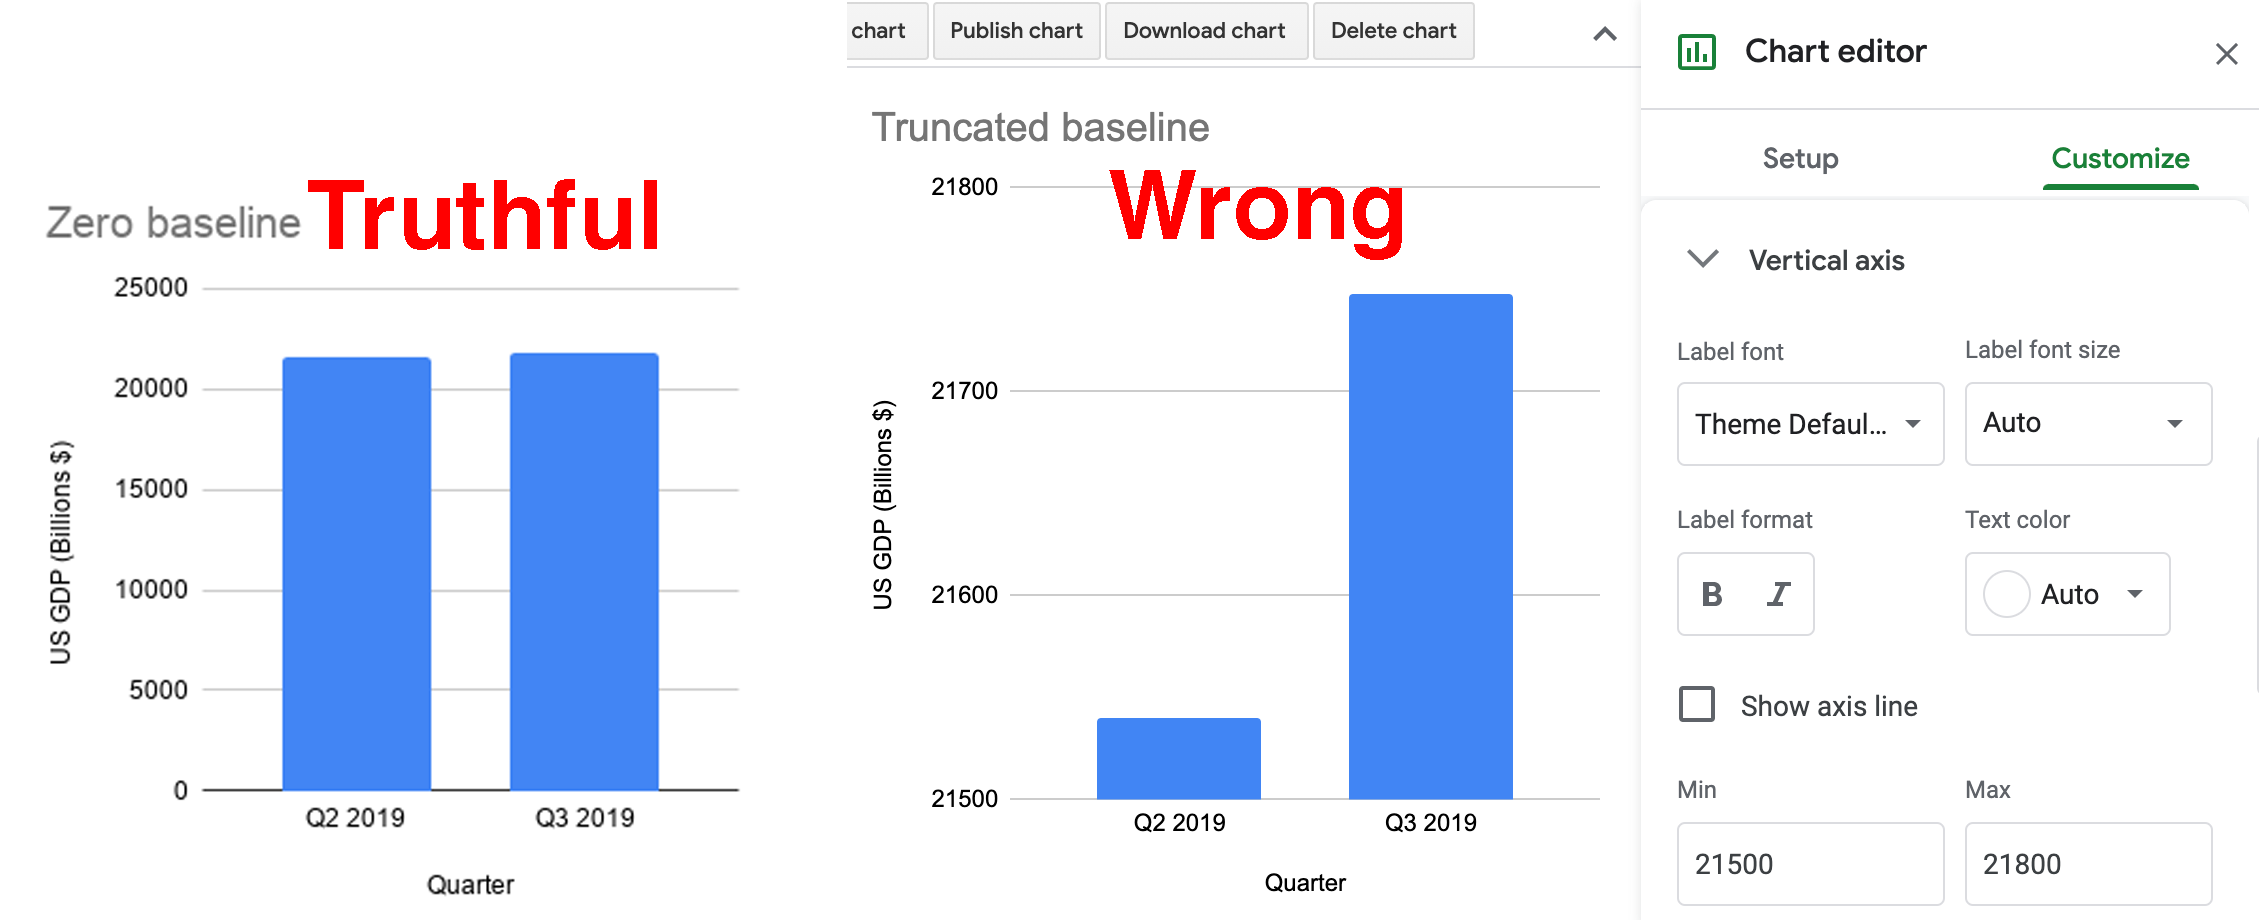
And what is going on with that Y axis? There is no consistent spacing between the marks!
Re:FreeBSD/EC2 boot performance over time
by cperciva on Tuesday October 15, 2024 @10:12PM
(#41854967)
It's a bit hard for a log axis to start at zero.
Re:FreeBSD/EC2 boot performance over time
by amiga386 on Tuesday October 15, 2024 @10:35PM
(#41855076)
Well start it at 0.00001 then. There's no need for a log axis, as all the values are within 2 orders of magnitude of each other - between 1 and 100. They will fit better, and will no longer be distorted, on a linear Y axis starting from zero.