Your naive hypothesis is true. The ratio of cash to non-cash has been decreasing over time, as more digital payments are used. As everyone also knows, cash is a nominal value, it doesn't inflate. Anyone trying to intuit cash demand would be thinking about inflation rates and nominal gdp growth.
In fact this naive thinking is a pretty good explanation for the graph in your source: https://www.rba.gov.au/publications/bulletin/2021/mar/images...
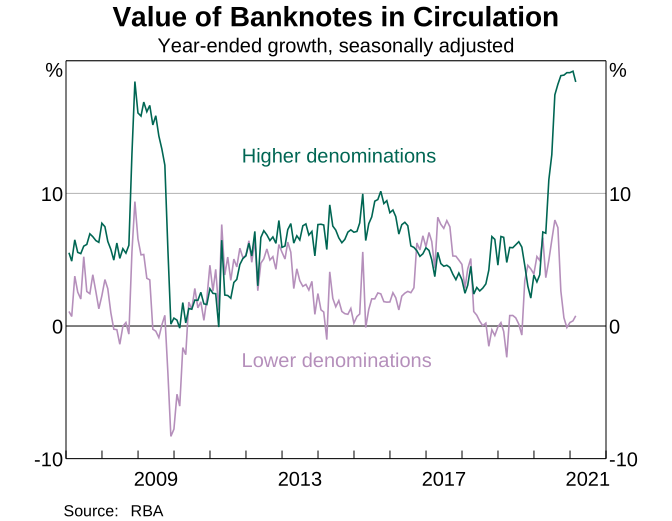
I think digital payments would explain a lot of why the correlation sharply reverses in 2020.
The problem is if you want to go further and say; since digital payments will increase during the pandemic, all demand for cash will decrease. I disagree that's an intuitive idea.
Covid changed the money supply and peoples behavior rapidly, saying you can't use intuition under higher uncertainty is a tautology - no field is immune to this. Also going past intuition, the decline in cash as a percentage of total money accelerated, due to the M2 increase being much larger.
Just because covid shocked a few things doesn't mean that economics insn't intuitive or that peoples intuition is wrong. It's like trying to reason about terrorist attack danger using data just after 9/11.
An example, nobody uses cash for payments anymore, demand for bank notes must be down. And yet: https://www.rba.gov.au/publications/bulletin/2021/mar/pdf/ca...