Re:Putin ‘purges’ 150 FSB agents in response to Russia’s bot...
by Sammi on Tuesday April 12, 2022 @10:52AM
(#31003515)
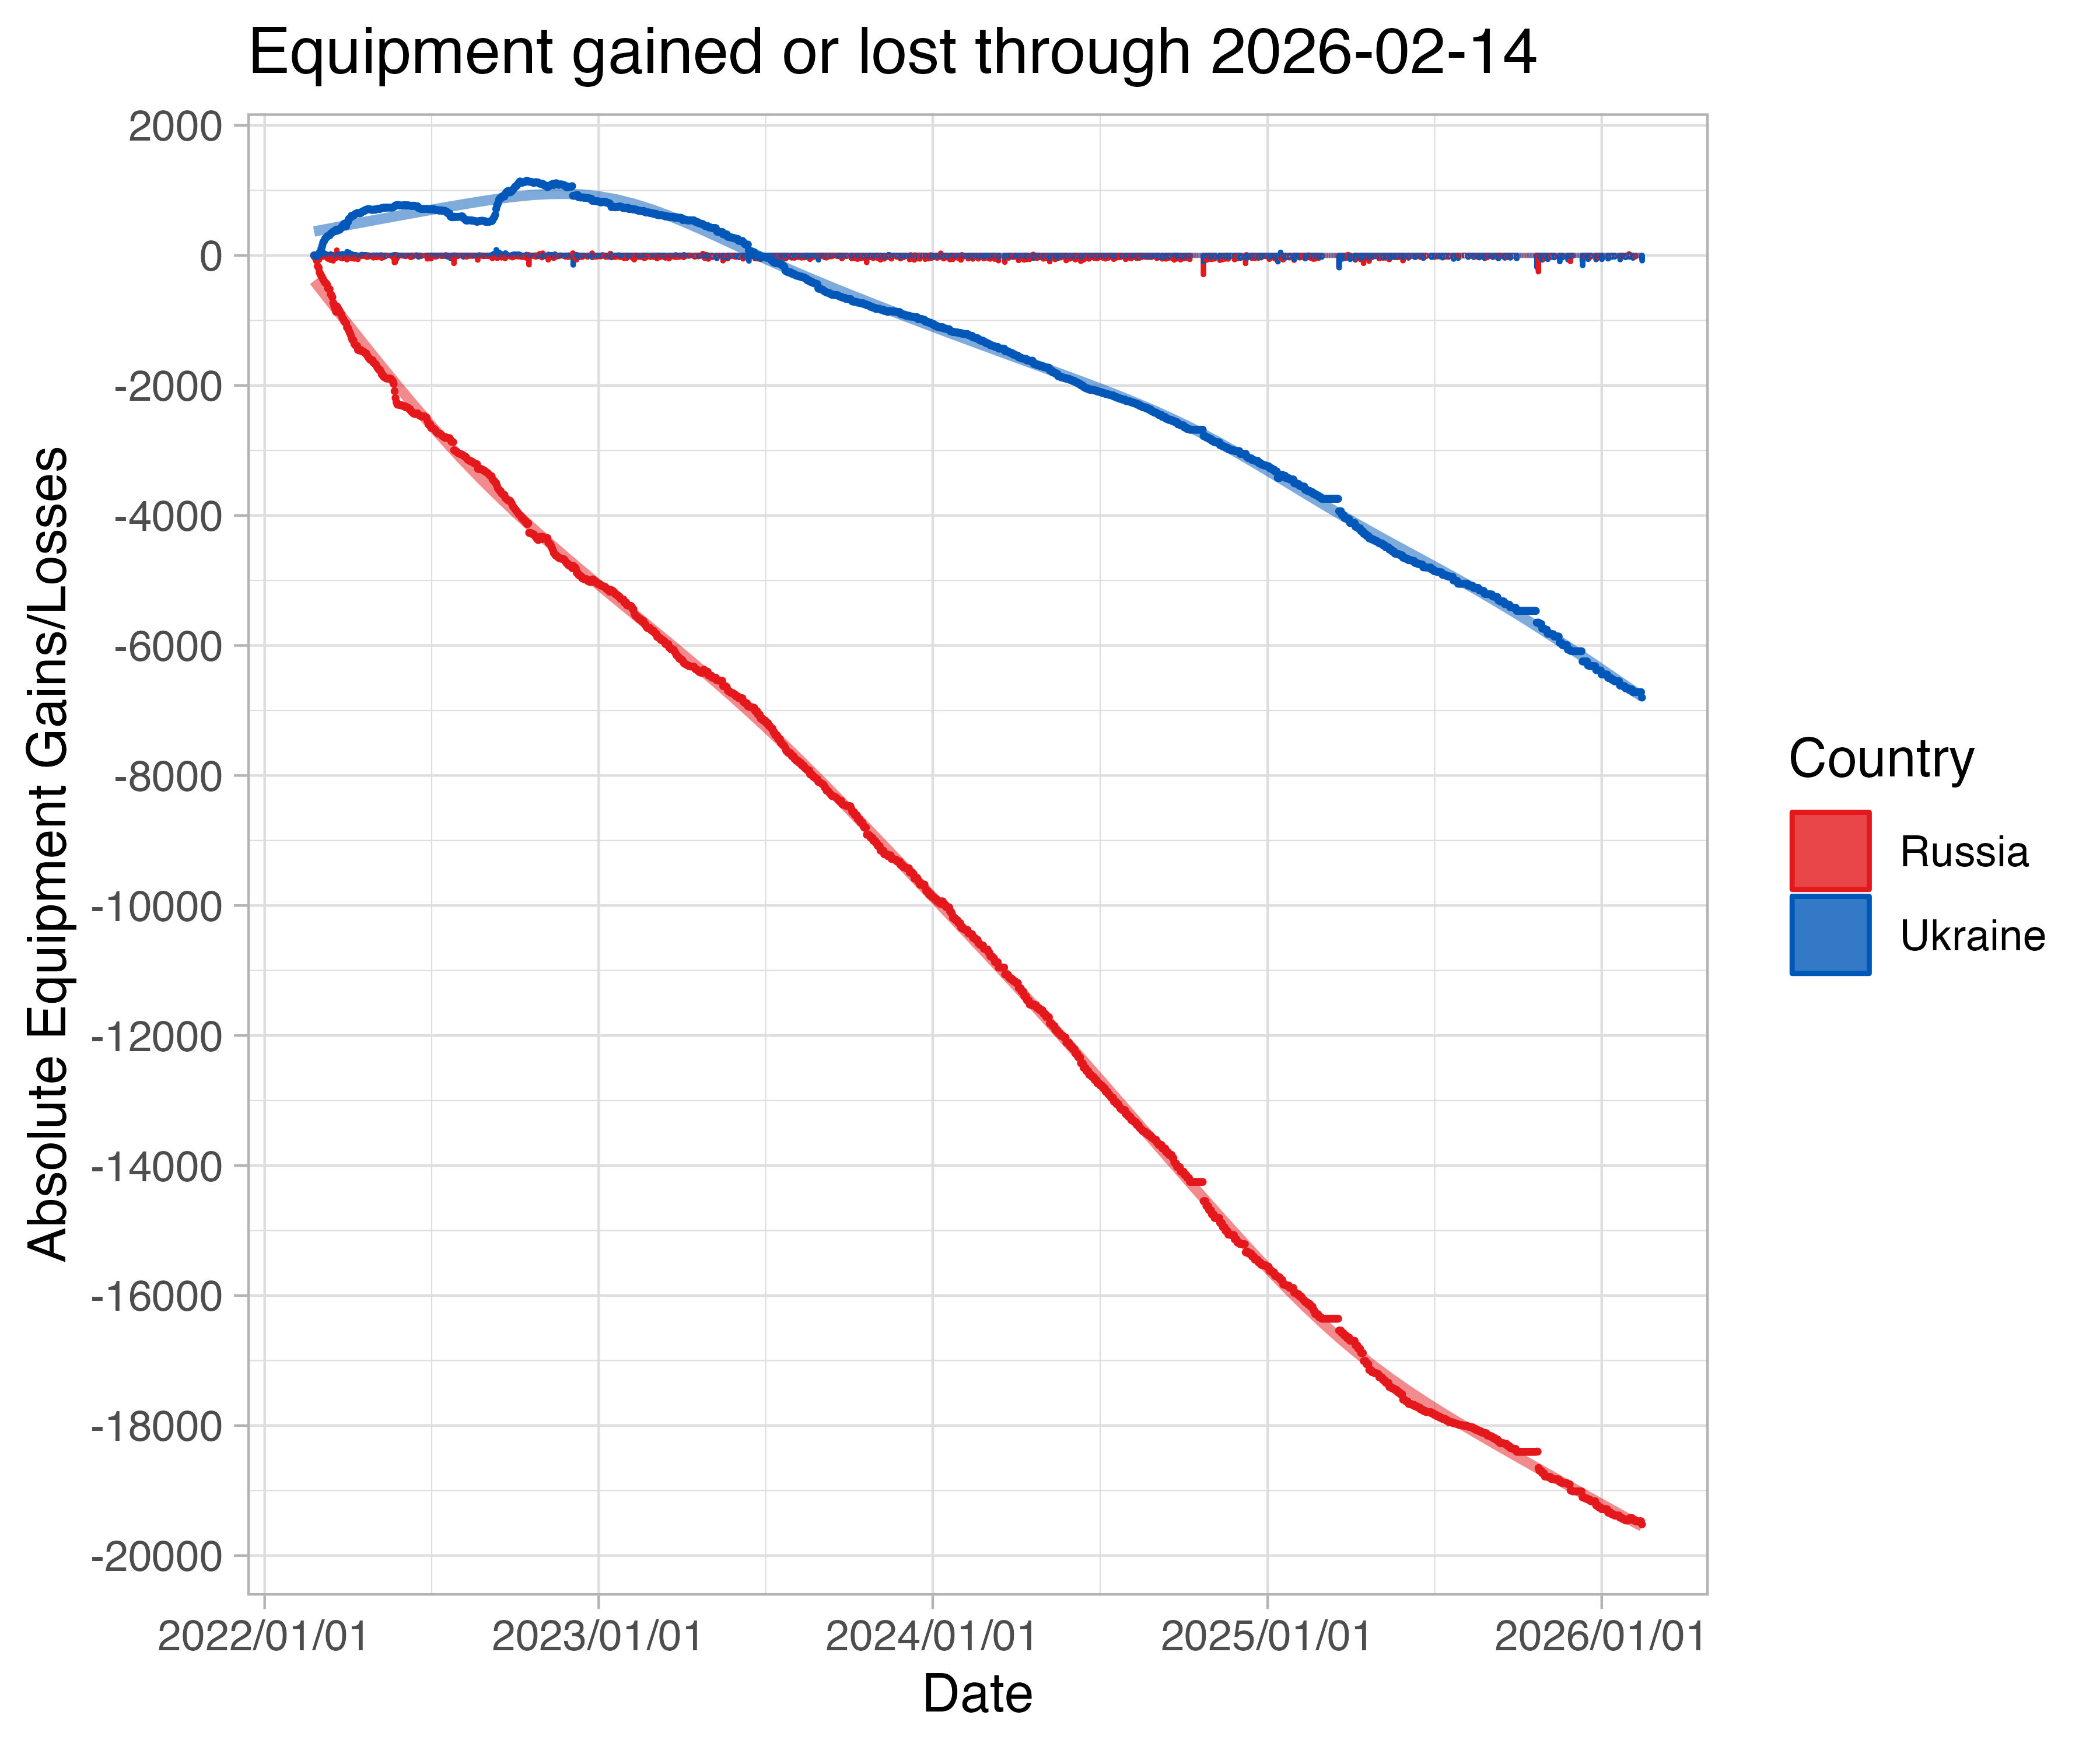
There's a git repo with graphs drawn from the data of confirmed visual sightings of equipment:
https://github.com/leedrake5/Russia-Ukraine
In particular this graph here which shows Russia is at at steep net loss over time, while Ukraine is gaining modestly over time:
https://raw.githubusercontent.com/leedrake5/Russia-Ukraine/m...?
Can I ask where you found this data? Specifically, I'd like to see the math of the war. Ideally, I want to see graphs over time.