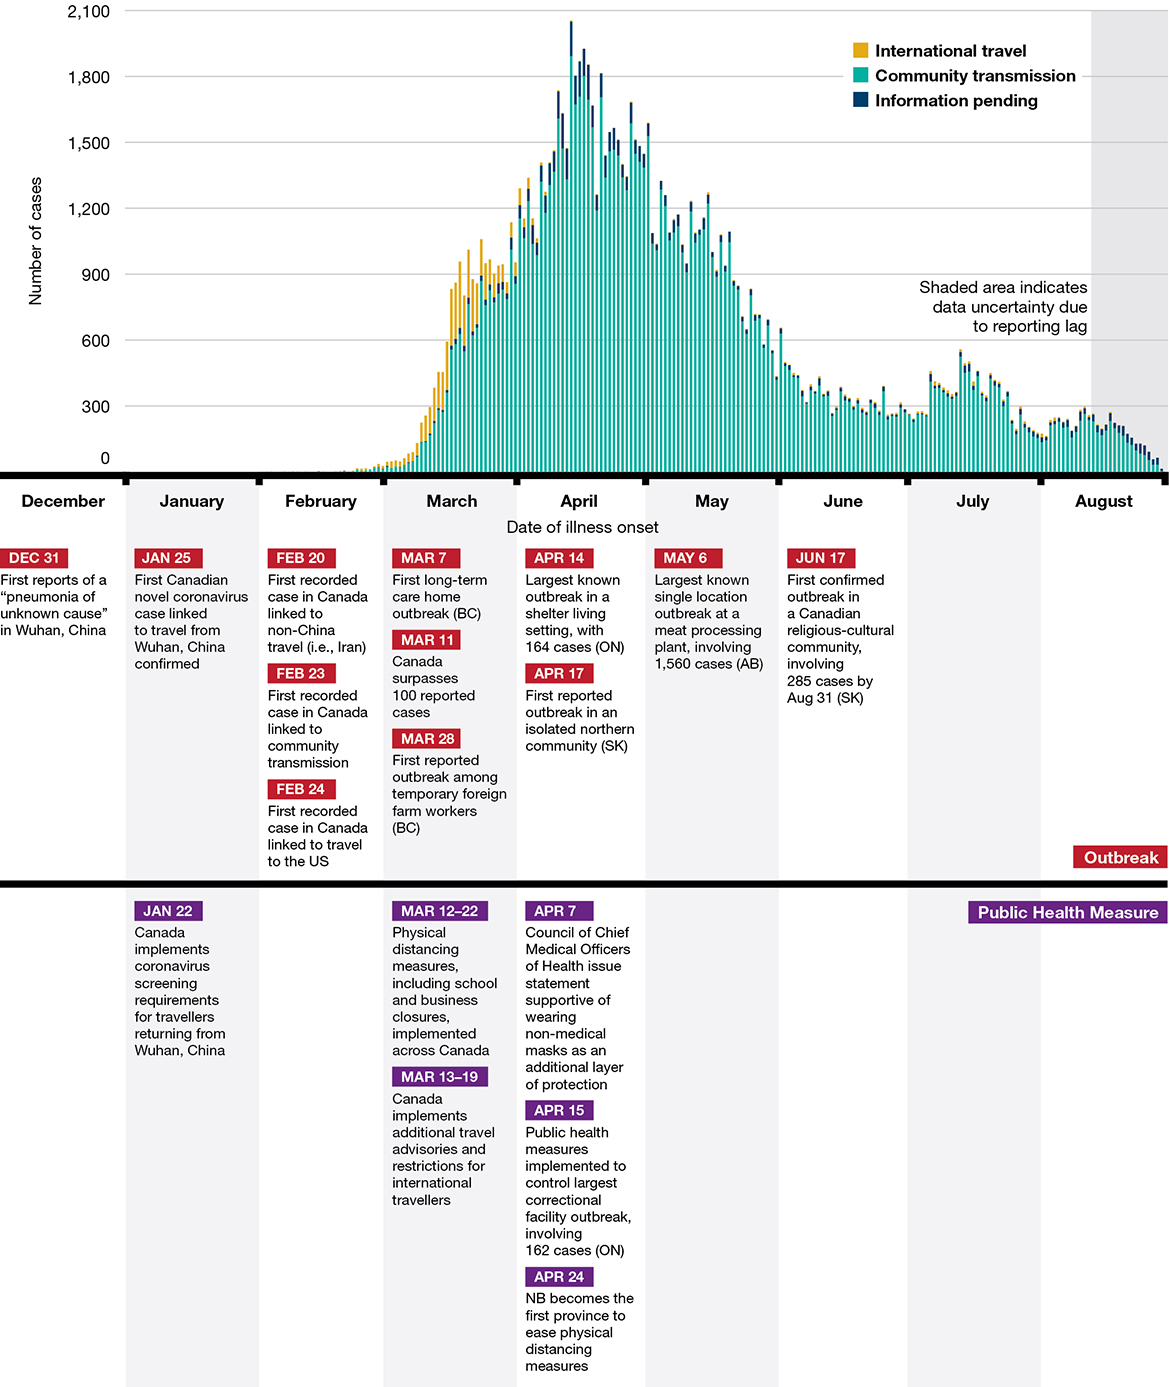
Quite exactly the opposite is actually true: it's always very clear from such charts that the measures are very effective.
Some examples:
https://www.canada.ca/content/dam/phac-aspc/images/corporate...
https://www.nejm.org/na101/home/literatum/publisher/mms/jour...

https://coronavirus.jhu.edu/data/state-timeline
Doesn't take "PhD level math" either, just some basic understanding how the effects are delayed by incubation period, testing and reporting, and how an exponential function changes shape as the exponent changes
Some cases will incubate nearly right away, and others will take more than the 2-3 weeks that are often used as quarantine periods. Getting to the 95th or 99th percentile is not the same thing as getting to the 100th percentile.
This is one of the reasons that a covid-zero strategy is effectively unimplementable.
You’d be hard pressed to find studies that say none of this worked. Such researchers would destroy their careers and be labeled as kooks.
If this is true, why is it when showing a chart of data it is almost impossible to pick when any of these measures went into effect? If these measures worked to any worthwhile degree their effect on any data should be absolutely profound. Thus far, you'd have a hard time picking florida out from oregon or california. If you need PhD level math to prove that all these NPI'S work... it means they weren't worth the extremely toxic and corrosive effectives they've had on our communities. Any fool off the street should be able to look at the raw data and see the impact, which currently you can't do.