But the headline is clearly that deaths have fallen ~70% even as total (reported) cases has continued to grow exponentially.
3 weeks from today we will have about 2200 deaths per day, based on the 7 day moving average.
The case fatality rate for the virus is going down due to increased testing (identifying more cases) and better treatment (Remdesivir, dexamethasone, and better medical knowledge in general).
So it won’t be as bad as a naive extrapolation might make things look. Still bad though.
All else being equal, if the case count triples, the death count is going to triple. Now in this case there are two things that aren't equal. #1 is that the cases are more biased towards younger people, and #2 is that positivity has increased. I expect that these two factors will roughly cancel each other out and the death count will be about 2200. Would you care to place a wager on the over/under at 1600?
The other big issue of course is lag. If you look at daily positive tests, current hospitalizations and newly reported deaths in one graph the lag becomes more visible.
Here I e.g. just used a log y axis to show all three in one plot: https://anarazel.de/t/2020-07-13/all_in_one.png
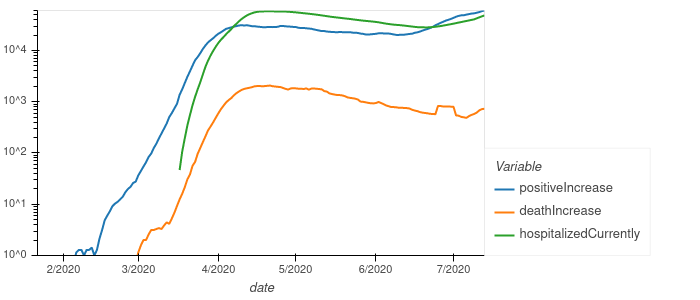
which imo makes that more visible.
It happened a week ago. It's easier to see when you look at a moving average.
https://imgur.com/a/xGLRjGa
https://www.worldometers.info/coronavirus/country/us/
https://ourworldindata.org/grapher/covid-daily-deaths-trajec...