Yes! So many of the mind-mapping software is limited to just trees, plus there's no way of styling some paths differently, the interface is far from ergonomic, in short: I couldn't find an interactive tool for drawing complex relationships between many kinds of content (I want to be able to put an image in one place, then paste a bit of some documentation in another, then connect them in some way, then repeat this 100 times and then have the tool "auto-layout" all the content.)
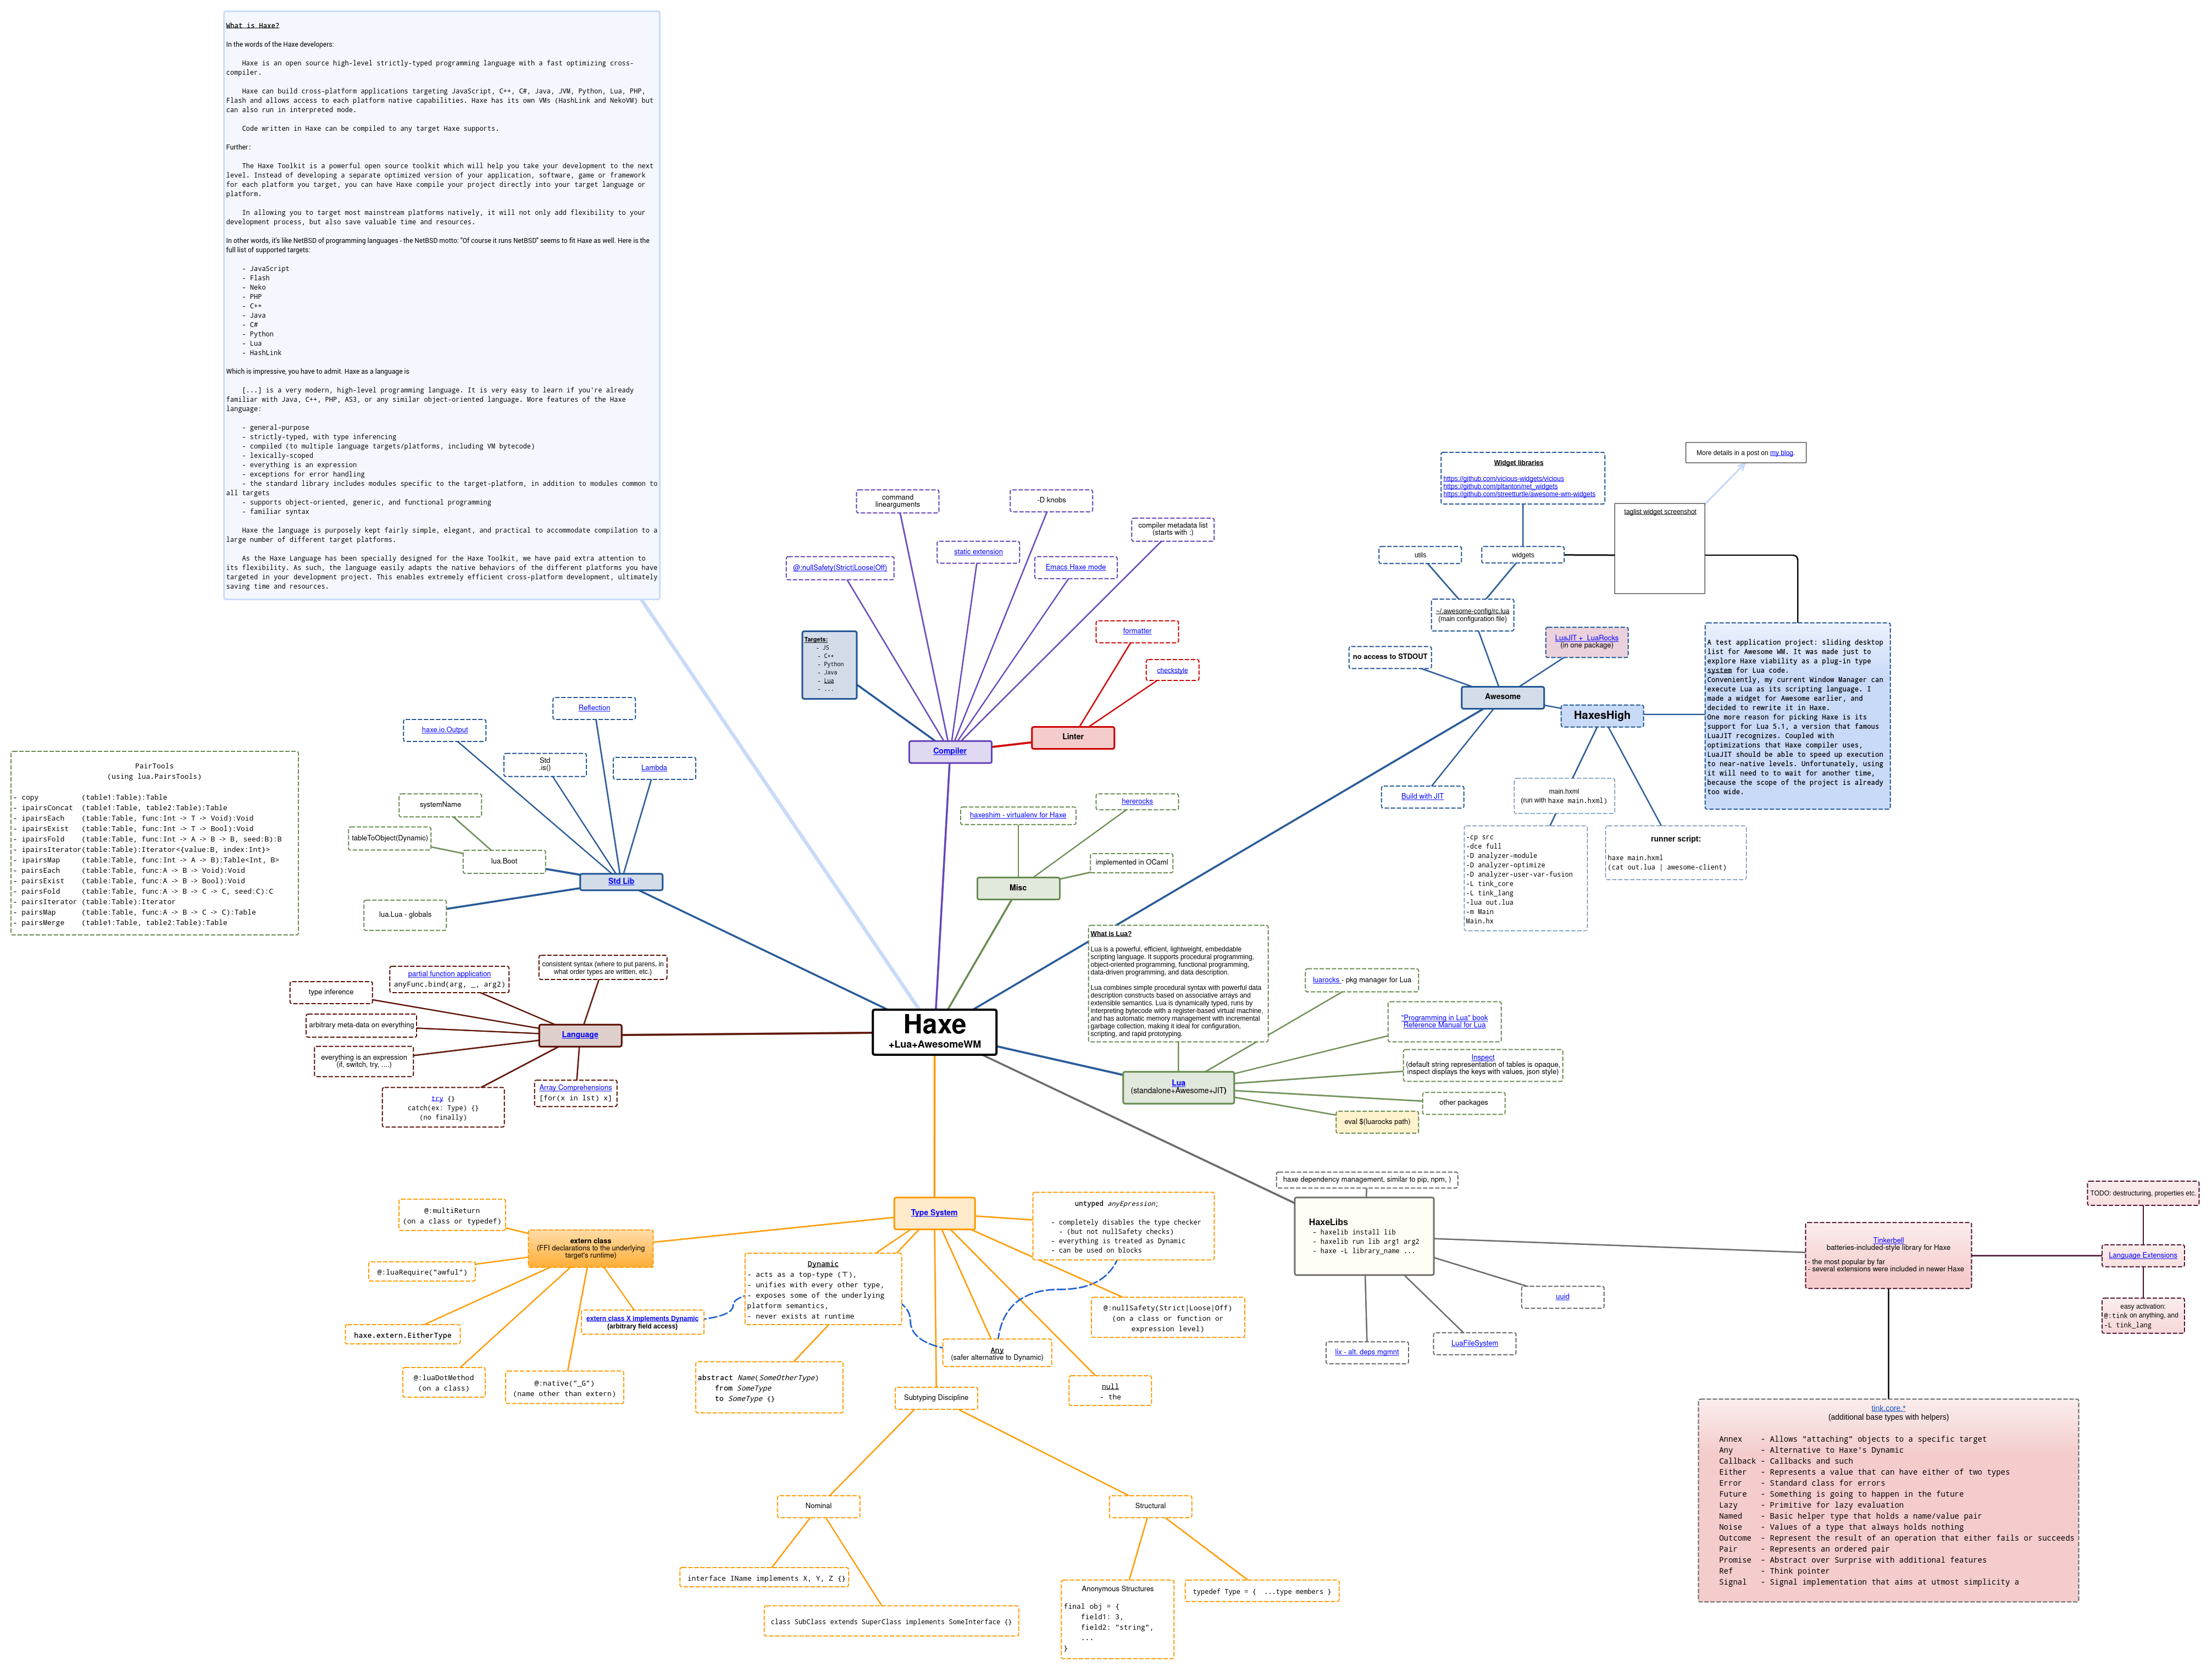
Here's the thing I'm currently trying to create: https://github.com/piotrklibert/awesome-config - I need it in SVG so that the links are working, plus it would be nice to be able to show/hide portions of the graph. I'm currently using Gliffy, but it's getting slower and buggier with every box added.
Any advice on what to use for things like these?
I know and like pure-text diagramming solutions, but they don't work that well for diagrams designed to span multiple displays in width or height. Or put another way - my editor, as glorious as it is, is not designed for rapid zoom-in/zoom-out on various parts of an 80000x80000 rows/cols text file. I want to be able to work in an interactive environment, where I can rapidly switch between the overall outline view and the focused, detailed view of just a few nodes. Moreover, I need to able to embed (and preview if possible) different kinds of content, from syntax-highlighted text to images to videos, plus it should render natively in a browser (hence the SVG).
My use case for this is putting together a knowledge-base (think Wikipedia, just for my personal data), which would use direction, color, line thickness and kind (dotted, dashed, etc.) to bind related subjects and show the relations between them in 2 dimensions. Feature-wise Gliffy is close to what I have in mind, but it doesn't handle a scale big enough to be called a "knowledge-base" - "infographic" is the most it can produce.
[2] https://raw.githubusercontent.com/piotrklibert/awesome-confi... (made with Gliffy)
Eg. Mind maps aren't trees- they are bigraphs, this is limited to trees.
Someone needs to plug in this renderer with Graphviz.