News for hackers. Stuff that matters.

crjn

Re:Easel.ly - A nice HTML 5 infographics editor on Monday May 14, 2012 @08:40AM (#3970777)
Data visualization is a deep science and tightly related to business intelligence. It always start with data. You first list them as a simple table (raw data) and then you decide how best to show it to the world. So you start aggregating, clustering, ranking etc to refine the data and come to conclusions yourself.

Once you come to conclusion, you keep rethinking and validating that these are the right conclusions and once confirmed the next challenge is how to articulate your conclusions to the world.

You then go to your designer and give enough information to be translated to infographics/dashboard. You see it is a very involved process.

I always think my data can be easily converted to a bar chart, line or pie chart. Rest all are variations of the same. If you have a third dimension then you go to bubble or scatter charts. So visualization without data is just a wireframe

Re:Easel.ly - A nice HTML 5 infographics editor on Monday May 14, 2012 @08:26AM (#3970725)
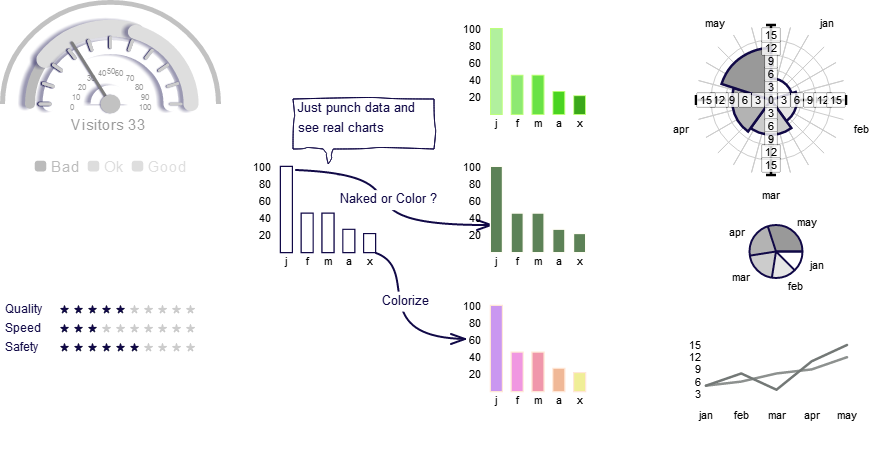
So true, without data binding it is just a graphic editor or a mockup creator. Here is a new webbased dashboard/infographic app coming in few days http://www.infocaptor.com/help/infocaptor_enterprise.htm

It has the canvas drag drop and integrates with google spreadsheet or your database to build infographics style dashboards. Infographics without data is a static image, data adds life to it.

Ask : Free equity to celebrity web profiles

It seems getting endorsements from big celebrities on the web goes a long distance in gaining traction for your startup. Does it make sense to provide free equity to them in exchange for them to be our Advisors, be in board of directors?If so, how to pursue it?Has anyone done it?How much equity to provide for say 10 Mil+ valuation?
( Read More... | 1 comment | on HN )
Re:Getting around the London 2012 branding police on Monday April 16, 2012 @12:33PM (#3848057)
Have Bumblebee from Transformers say the message for you. He could dig into radio archives, historical records,youtube videos, get clippings on the fly and construct the message in his style. I bet no-one can object that
Re:Simple SVG gauge built with Raphael on Monday April 02, 2012 @10:04AM (#3788130)
Here is one example built for html5 but extremely configurable https://www.wireframes.org/ui/data/admin/wireframes_demo_4ee...
Did anyone figure out what is the company behind it?
When did a programming language became the core of solving scalability problems?