Re:Airline flights of the world visualized with WebGL
by timmipetit on Wednesday February 18, 2015 @03:07AM
(#9067488)
That's really cool! I did something similar for my thesis. We used flight information from http://planefinder.net/ as our data set. Unfortunately no WebGL, but you can see an impression in this Youtube video: https://www.youtube.com/watch?v=XvrdxLymMv0
More info here: http://www.cs.rug.nl/svcg/SoftVis/FlightVis
[ Parent
| on HN ]
Re:Airline flights of the world visualized with WebGL
by callumprentice on Wednesday February 18, 2015 @09:23AM
(#9068604)
Very nice Tim - I love the way you smear out the data.
I found plotting the data over Europe and the US to be a difficult visualization problem - there is just so much data in a small space. Perhaps changing the size of each point depending on your distance would work?
Re:Airline flights of the world visualized with WebGL
by timmipetit on Wednesday February 18, 2015 @09:54AM
(#9068783)
Yeah, especially Europe is really hard. We haven't found a solution yet for visualizing detailed information above very dense and scarce areas at the same time.
Showing the data above a single country in Europe works a lot better (for example: http://www.cs.rug.nl/svcg/uploads/SoftVis/trails_length_1.pn... and http://www.cs.rug.nl/svcg/uploads/SoftVis/trails_length_4.pn... ). We use an option to reduce the point size based on the zoom-level.
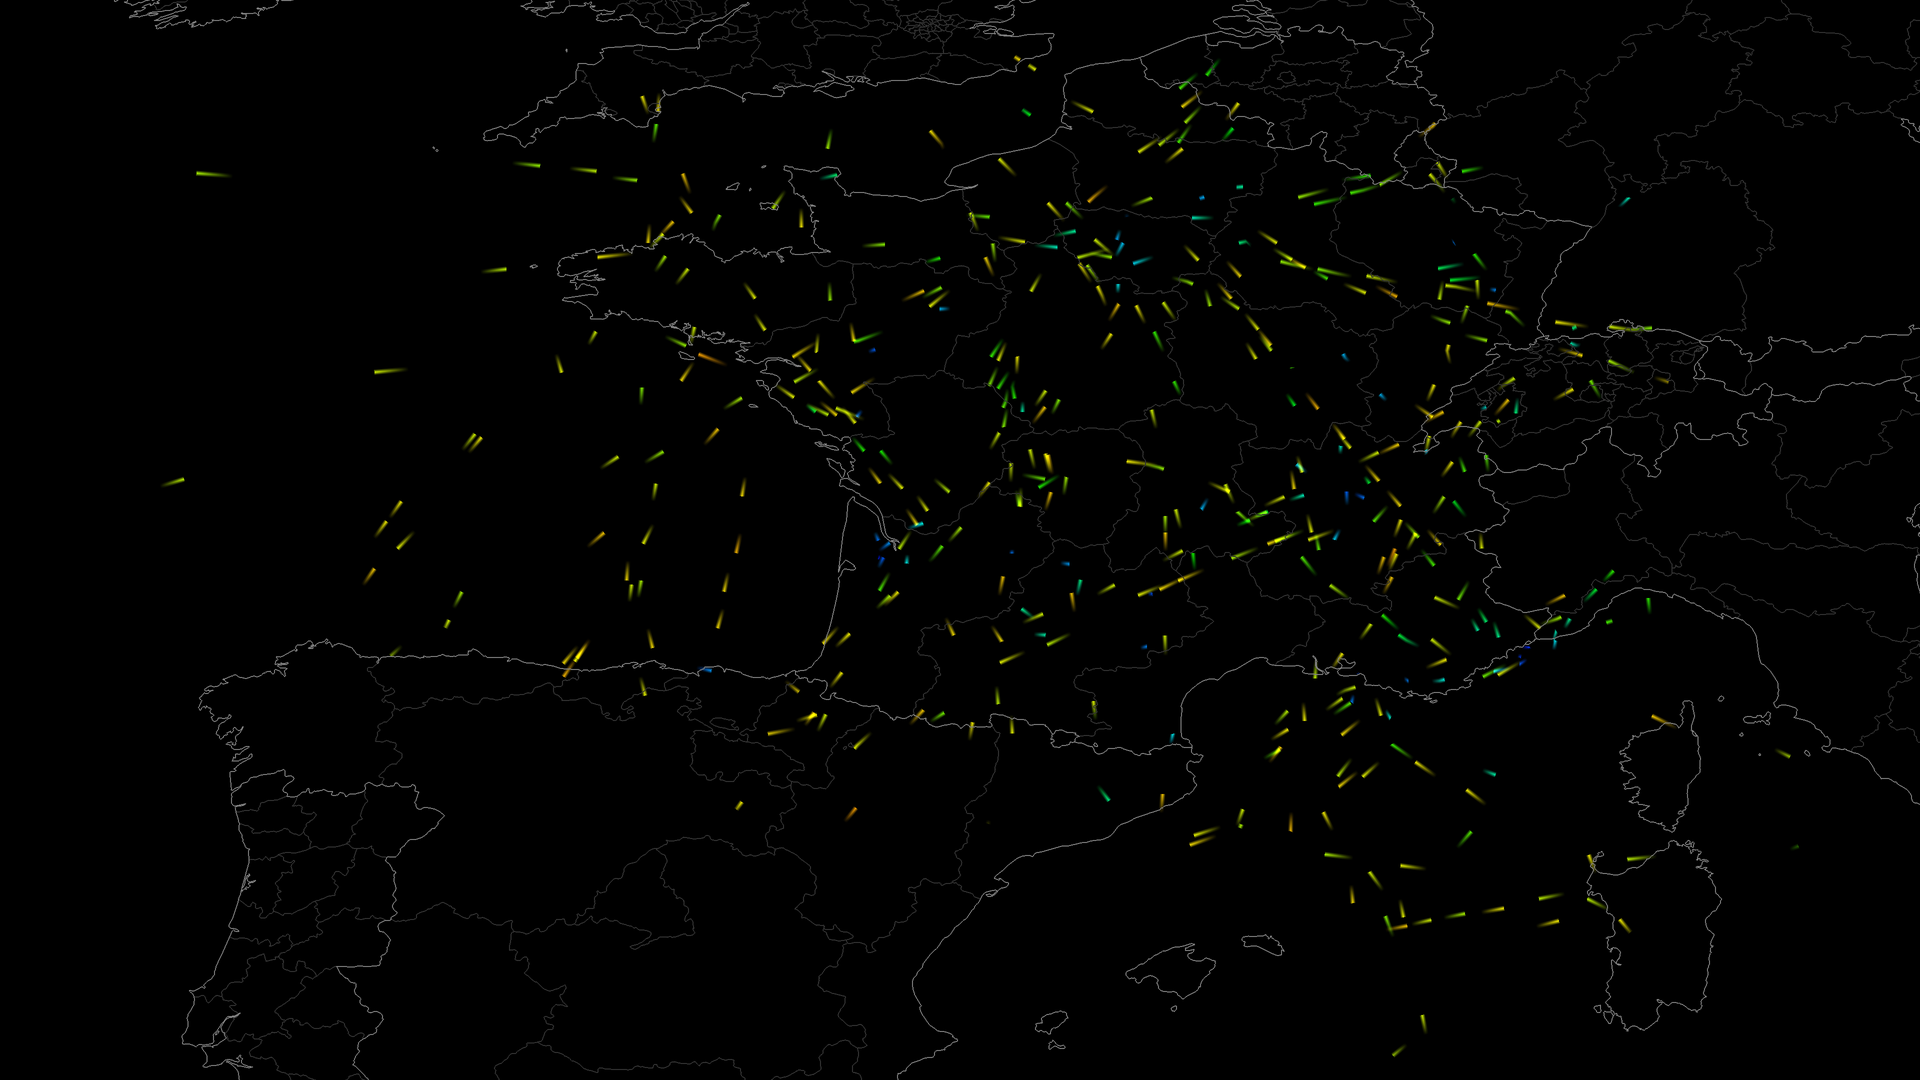
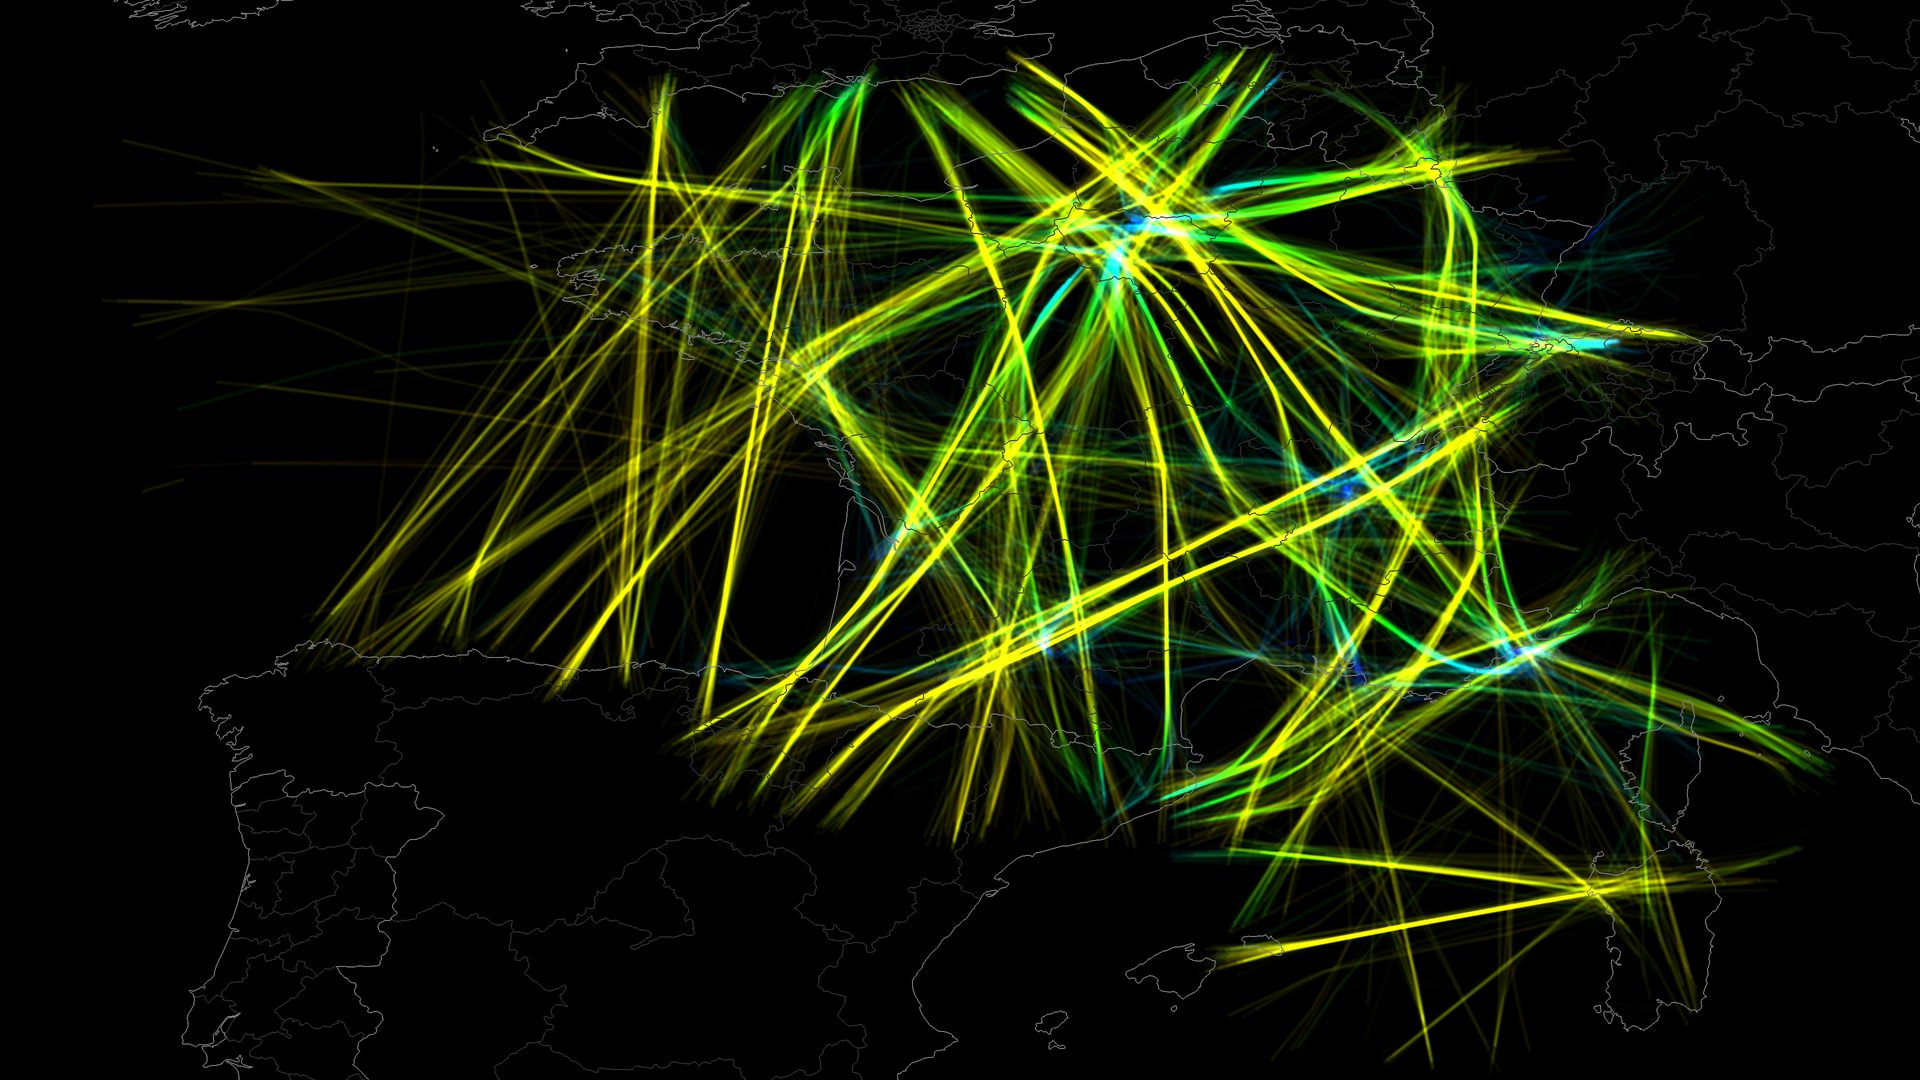
If someone is interested, here are 2 more videos of our visualization
* https://www.youtube.com/watch?v=GYfBvQGKE9Y (short pulse-trails with background context, colored by altitude, above France)
* https://www.youtube.com/watch?v=0oqxIhO69tU (medium pulse-trails, no background trails, colored by direction).
For more information and pictures: http://www.cs.rug.nl/~alext/PAPERS/MSc/klein14.pdf