
It's why signal processing folks will insist on plotting sampled signals as lollipop plots, NOT step (aka zero-order-hold) signals. http://www.ling.upenn.edu/courses/ling525/swave2.gif
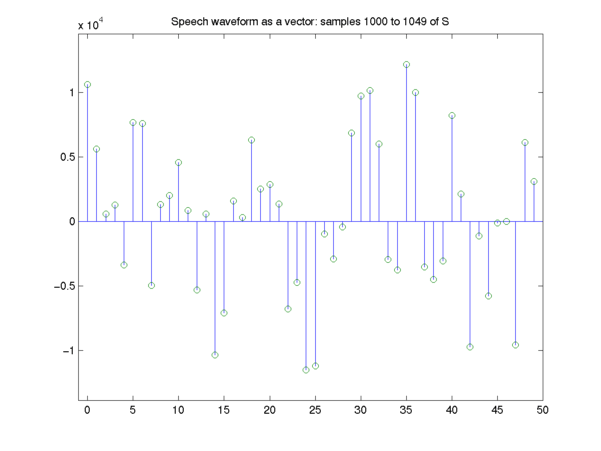
The reason why is it treats appropriately an ambiguity in a sampled signal... the fact that anything at all could happen between two samples, but all you see is the value at that point. Stated another way, any line that goes through those green circles could have been the original sampled signal. I might also add that the zero-order-hold isn't even a minimal energy or GOOD interpolation of the original signal. Typically when sampling, you band limit the input to the nyquist frequency. That way a PERFECT reconstruction can be done. Yes I know that's weird. If you band limit a signal and discretely sample it, you may reconstruct it PERFECTLY. The perfect reconstruction may be generated through the Whittaker–Shannon interpolation formula. A zero-order hold will interpolate the signal in a way that will create tons of harmonics outside the band of interest. It's wrong. It's the wrong way to think about sampling.
However, this is not true for pixels. The meaning of the pixel values in a source image is arbitrary. It can be point-like, but I would argue it mostly isn't.
Pixels in a display device /never/ are point-like. They always fill an area. That's just a physical reality.
We also can not use a simple band pass to limit the (spatial) frequency content. If you take the videolinked in the sister comment, and assume that t is a spatial direction.
A pattern like __^^^___^^^___^^, that is black-white-black-white... would show ringing when the slopes don't match pixel borders. What do we do instead? Either align it, or integrate over the pixel area. I.e., the pixel overlapping the slopes would have grey values.
(Edit: realized parent post didn't link the video)
[0] http://gis.stackexchange.com/questions/10931/what-is-lanczos...
Using actual signal generators and oscilloscopes, this guy proves by experiment everything you said. Goes into differences between sampling rate and quantization depth as well. Well worth the watch.
It's one thing when writing a compositing window manager or blitting sprites to the screen; it's another thing entirely when doing any kind of image processing to make that assumption.
It's similar to assuming that RGB (0-255) is perceptually linear and consistent among monitors (not understanding monitor profiles and color spaces)
OK, it's an abstraction, but the article didn't seem to cover the strength of weakness of various implementations.
The samples in the source image, and the tiny light sources that vary in intensity and are driven by a voltage after the information in the bits in the source image has traveled through the display pipeline are two different things.
The author discusses the best way to think about the source image. It will get really awkward if we want to discuss imaging algorithms and have to define "my pixel is a square... if it's a bunch of weird shapes the transform is this... etc." It's easiest from this point of view to think of the source image as a lattice of point samples and figure out what the sampling function (our physical pixels) do to the image after we have figured out the math on the point sample source.