http://www.asymco.com/wp-content/uploads/2013/06/Screen-Shot...
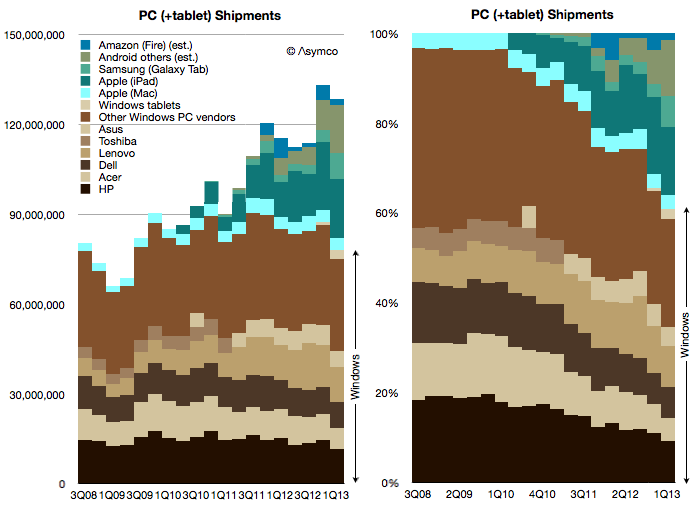
RE: dishonesty, see for example http://www.leancrew.com/all-this/2011/11/i-hate-stacked-area...
RE: inefficiency, note how bad the trend lines become near the top as the noise accumulates from the curves below. e.g. the galaxy tab curve on the left. I am reduced to visually converting areas into numbers (something humans are quite bad at) and searching for the previous data point, etc.
The one major thing this chart has going for it, though, is that it makes me want to play some old school video games.
Yes, the author's fictitious example sucks.
The chart I linked shows the data points as discrete, so it's actually the stacked column chart the author claims to prefer and eliminates the confusion between height and thickness (that said, I don't object violently to that specific issue since I know how to read the charts).
Why convert curves to numbers? If you just wanted numbers read tabular data.
Tufte uses the equivalent of stacked area charts in one of his most famous examples (Napoleon's attack on Russia). Is it the width or the height of the bar that connotes the strength of the army?
http://www.google.com/imgres?imgurl=http://cartographia.file...

Tufte's great. You can quote him on both sides of most arguments. Displaying information well requires judgment, not just a bunch of rules.
Please note that in the (excellent) Napoleon chart, cross sectional thickness is used to convey the size of the army. Not only is this intuitive, but it is masterfully hinted by the way the line shrinks. Stacked area charts (as detailed in the article I linked) however are unintuitive - a slowly increasing trend stacked on a faster increasing trend will appear to decrease - this is very undesirable.
The chart you linked seems to want to say "The PC(+tablet) market is increasing, but Window's user base is stagnant". Either unstack the data or throw away/combine the irrelevant data. If you want to compare the Galaxy Tab to other Android tablets (as this chart seems to want to do as well) you will need a better chart or a second chart. The top of left chart is visual noise.
What struck me however was how little the popularity of the largest languages changed in terms of their question frequency.