What I've seen many times though in my career that awkwardly spans EE and CS is that people forget that you can still... write equations instead of doing everything in Simulink. As an example I was looking at a simplified model of an aircraft a couple months ago.
One of the things it needed to compute was the density of air at a given altitude. This is a somewhat complicated equation that is a function of altitude, temperature (which can be modelled as a function of altitude), and some other stuff. These are, despite being a bit complicated, straightforward equations. The person who had made this model didn't write the equations, though, they instead made a Simulink sub-model for it with a bunch of addition, multiplication, and division blocks in a ratsnest.
I think the Simulink approach should be used when it brings clarity to the problem, and should be abandoned when it obscures the problem. In this case it took a ton of mental energy to reassemble all of the blocks back into a simple closed-form equation and then further re-arranging to verify that it matched the textbook equation.
A related phenomenon seems to be people who don't want to "wire up" schematics but attach named nets to every component and then draw boxes around them.
Lol there are a few things that I am highly intolerant of and this is one of them. The only place where I'm generally ok with that approach is at the input connectors, the microcontroller, and the output connectors. Same philosophy as I said before though: "if it brings clarity draw it as a wired up schematic; if it turns into a ratsnest use net labels to jump somewhere else". Having every component in a separate box with net labels will generally obscure what's going on and just turns it into an easter egg hunt.
Here’s an example that I think takes it too far: https://cdn.sparkfun.com/datasheets/Dev/LilyPad/LilyPad-MP3-...
- The audio jack (line level) could have just sat to the right of the codec and been directly connected to it to make it clear that it’s just a direct output
- the speaker amplifier could be directly connected to the audio jack as well. I spent a lot of time looking around to figure out where it actually connects to; I figured it would have its input connected to the MP3 codec and didn’t realize that it would be connected through the micro switches inside the headphone jack (which makes sense now that I see it)
- the SD card slot could either be connected directly to the codec or could have better names on the nets. When I see MOSI, MISO, and SCK I assume that they’re connected to the main MCU. Even more confusing, there’s an SD-CS that is connected to the MCU but not the rest of the SPI pins
Overall I’d probably give this one a B. It’s by no means the most egregious I’ve seen but it also obscures the signal flow pretty badly.
Other things I would probably consider doing:
- better clustering of pins on the MCU by function. The switch inputs and LED outputs that connect to the rotary encoder are all over the place. Most tools allow you to move the pins on microcontrollers around at will
- the FTDI block could move onto the first page. The DTR pin could use a bit of explanation that it’s tied to the reset circuit. Not their fault in this one but the naming inconsistency between FTDI-RXI and TRIG4/TXO is confusing until you figure out that the pin is meant to be either a GPIO or a UART pin. The name doesn’t make it clear that it goes to the FTDI chip because it’s inconsistent with the rest of the FTDI-xxx names but that’s because most ECAD programs handle net names poorly anyway
Edit: one more thing that really bugs me about this schematic: the Vbatt net leaving J1. It’s labelled but not with any kind of flag or loose/unterminated line that would indicate that it’s connected to the net leaving U2. And further with that, the fact that VIN on U2 comes only from the FTDI connector on the second page (I think…)
- Making the power routing completely implicit is another hallmark of the style and it drives me crazy too. The power, charging, and maybe FTDI boxes should all be together on one page. Now, I might change my mind about this in six months, but I am starting to warm to the idea of drawing a power tree for even pretty simple power schemes like this one. The power tree style in the Arduino documentation is pretty nice
- In the same vein, even modest designs usually benefit from a block diagram up front. You don't need to use hierarchical design functions - just boxes and arrows and text done with the drawing tools of the CAD program
- I like that they actually did put most of the "bookkeeping" connections on the left side of the micro. I'd move the UART pins over to that side too, and the programming port. The programming port belongs with the micro and nowhere else, would you put it on its own page?
- Audio signals flow right to left to down for no particularly good reason except to get all the other boxes to fit on the second page. All the audio could be on its own page
- Similarly, LED signals come in to the rotary encoder on the right and encoder signals come out on the left. Really?
- I like that they grouped the bypass capacitors with the ICs but for these modest numbers of bypass caps I prefer to see them shown connected to the pin pairs they'll be placed by
- OK, not a schematic point and not critical for a hobbyist product but powering the battery charger from USB is a potential issue. Low line by spec on USB is 4V at the connector, and you won't get 4.2V out of that with a linear charge controller. They might also be exceeding maximum effective capacitance on the USB power bus. Again, not critical for a low-volume "maker" product - it will always work except when it doesn't
- No off-page connectors for off-page connections. I like to see the pages called out that an off-page connector connects to, but I admit that's a pain to do by hand
- The pull-ups and pull-downs in the top right hand corner of the second page are typical of the style. Who ever heard of connecting these directly to the pin that needs them? Again, it looks like this was done to fit the subcircuit in the box
I'm laughing/crying right now because of a board I had to deal with last week at $JOB. Pretty beefy power distribution board with some... quirks related to load shedding etc. Details don't matter there. I ended up drawing the whole power graph (it's not a tree, there are two independent inputs that go through ideal diode controllers for some of the rails for redundancy). By carefully rearranging the nodes of the graph I managed to get it completely planar (no overlapping edges) except for one spot where a poorly-thought-out connector did require one edge overlap.
Laying that out as a planar graph dramatically simplified routing. It's a technique I hadn't explicitly used before and it sure worked out nicely.
I’m not a very visual thinker, though. If it were up to me schematics would just be written out in some kind of textual representation, but EDA tooling tends to make fiddling around with schematic diagrams the blessed path.
There are in fact ways that electronic media have changed schematic practice - it is extremely unlikely in 2024 that you will have a draftsman or CAD designer drawing your schematic from a sketch, though in some environments you might have a documentation team putting your work into a very strictly defined format, and it is pretty unlikely you will have a large-format plotter readily available. So the norm has shifted to multiple smaller pages, and there's little pain involved in adding another schematic page if you need one for clarity.
Note that sparkfun schematic was drawn for 8.5x11 paper even though the more natural size for full-size monitors is 11x17.
> Note that sparkfun schematic was drawn for 8.5x11 paper even though the more natural size for full-size monitors is 11x17.
Again a cultural issue. The tools assume by default that you want to produce a sheet of paper.
As documentation, in a production environment, your schematic will have a life beyond your EDA package. I've done sustaining work on designs that have outlasted the design packages they were done with. Without having to open them up, because there were schematics available in standard documentation formats. Eagle - as used in that lilypad design from 2013 - already has a sunset date. It's also a reality that EDA packages have poor backwards compatibility and even worse, their "import" functions rarely work at all well on non-trivial designs. That would be a fair criticism of the industry but for the most part redrawing a schematic and checking it against a netlist is not the end of the world. If you have one.
As an aside, it wouldn't shock me if lawyers print out source code, either. They print out everything else and store it on paper.
A move to open EDA formats is indeed long overdue. KiCad is a step in the right direction.
Take a system with multiple I2C devices - with each device on a different sheet, it becomes difficult to tell that you might have bus contention issues.
If everyone working on it has the software, they can count easily and accurately.
When I started and still sometimes today "just counting the number of devices" requires visiting each sheet of the schematic, then hoping you didn't miss one.
> That seems easier than if you had to follow a bunch of tangled lines.
Today's software will let you draw a single bus connection between all bus devices.
> That seems easier than if you had to follow a bunch of tangled lines.
The problem is generally that if you choose to put some things near each other, you're choosing to put other things further away. In many cases the I2C bus itself has little to do with what the I2C devices do, so by drawing a single I2C bus or pair connecting all the devices with splitting them up with a named bet, you're choosing to make those other things harder to show. This may or may not be appropriate for the design.
Any IC on the I2C bus will have pins labeled SCL and SDA, so you can easily just go through all the ICs and count how many have those pins. It might be slightly tedious with a paper schematic, but it's hardly impossible. It still strikes me as easier than doing the same thing with unlabeled pins that are connected directly in the schematic to the UC's I2C pins.
>In many cases the I2C bus itself has little to do with what the I2C devices do, so by drawing a single I2C bus or pair connecting all the devices with splitting them up with a named bet, you're choosing to make those other things harder to show.
I don't quite understand what you're saying here. Labelling a pin with SDA or SCL makes it clear that it's connected to the I2C bus. What I'm saying is that I don't see any value in drawing a line connecting the pin to all the other SDA/SCL lines. That's completely independent of how you lay the schematic out or split it into functional blocks.
What may only be slightly tedious for you will often be error-prone for someone else.
>I don't see any value in drawing a line connecting the pin to all the other SDA/SCL lines.
The value is that the entire bus is visible at a glance. All conflicts are visible, and contention sources understandable. Though, you can also put this information in a note/table.
>That's completely independent of how you lay the schematic out or split it into functional blocks.
What I mean is that it's often also valuable to split a schematic out along functions rather than busses. If you have an I2C ADC with a bunch of analog stuff connected to it, that might fit its own sheet better. But if your weather station I2C bus has several simple devices like Flash, ALS, humidity sensor, RTC, barometer, and thermometer, placing them together on one sheet may make sense. I just mean tidyness varies with the contents of the room.
You can split out all the components on the I2C bus onto a separate sheet (or not) regardless of whether you label or SDA and SCL lines or connect them with wires.
Imagine a home network diagram with a router, switches, and computers. You could draw each on their own sheet with names for each cable, but the purpose of each cable is clear from what it connects.
But once you -do- understand it's time to stick that in a reference file out of the way and write it again properly for actual use.
The quick gist is that Jupyter is frustrating for me because it's so easy to end up in a situation where you inadvertently end up with a cell higher up in your document that is using a value computed in a cell further down. It's all just one global namespace.
In the Julia world with Pluto they get around this by restricting what can go into cells a little bit (e.g. you have to do some gymnastics if you're going to try to assign more than one variable in a single cell); by doing it this way they can do much better dependency analysis and determine a valid ordering of your cells. It's just fine to move a bunch of calculation code to the end/appendix of your document and use the values higher up.
The idea I've been chewing on comes somewhat from using Obsidian and their whole infinite canvas idea. It seems like using ideas from Pluto around dependency analysis and being able to also determine whether the contents of a given cell are pure or not (i.e. whether they do IO or other syscalls, or will provide outputs that are solely a function of their inputs) should be able to make it easier to do something... notebook-like that benefits from cached computations while also having arbitrary computation graphs and kind of an infinite canvas of data analysis. Thinking like a circuit simulator, it should be possible to connect a "scope" onto the lines between cells to easily make plots on the fly to visualize what's happening.
Anyway, that's the quick brain dump. It's not well-formed at all yet. And honestly I would be delighted if someone reads this and steals the idea and builds it themselves so that I can just an off-the-shelf tool that doesn't frustrate me as much as Jupyter does :)
you could ditch explicit cells entirely, and implement your "scope" by selecting a (sub)expression and spying on the inputs/outputs.
I jest a bit, but there's a very rich ecosystem of really useful data analysis libraries with Python that do somewhat exist in other ecosystems (R, Julia, etc) but aren't nearly as... I would use the word polish, but a lot of the Python libraries have sharp edges as well. Well trodden might be a better word. My experience with doing heavy data analysis with Python and Julia is that both of them are often going to require some Googling to understand a weird pattern to accomplish something effectively but there's a much higher probability that you're going to find the answer quickly with Python.
I also don't really want to reinvent the universe on the first go.
It has occurred to me that it might be possible to do this in a style similar to org-mode though where it actually doesn't care what the underlying language is and you could just weave a bunch of languages together. Rust code interfacing with some hardware, C++ doing the Kalman filter, Python (via geopandas) doing geospatial computation, and R (via ggplot2) rendering the output. There's a data marshalling issue there of course, which I've also not spent too many cycles thinking about yet :)
Edit: I did copy and paste your comment into my notebook for chewing on while I'm travelling this weekend. Thanks for riffing with me!
It turns out non-programmers actually like graphical tools. Go figure.
But because it was all equations and logical reasoning, it was hard to understand, and boring to non-enthusiasts.
So my manager had me make a visual simulation instead, which we could then present to his managers.
This isn't as stupid as it sounds - we humans have huge visual processing networks. It makes sense to tap into that when interfacing with other humans.
I think to learn programming or math, you actually end up learning to use this visual wiring to think about written symbols. But this process of rewiring - while valuable - is very hard and slow, and only a tiny fraction of humans have gone through it.
https://www.youtube.com/watch?v=495nCzxM9PI
partly as a "this is what we were doing in 1962, you are now as far removed from that demo as that demo was removed from the year 1900 -- do you really feel like you've made the analogous/concomitant progress in programming?" ... and one of his points there was that a lot of programming acts as a "pop music" where you are trying to replicate the latest new sounds and marginally iterate on those, rather than study the classics and the greats and the legacy of awesome things that had been done in the past.
That specialist interfaces make you productive?
Sketchpad was just a cad tool, one of the first ones to be sure, but still a design tool.
We have substantially better ones today: https://www.youtube.com/watch?v=CIa4LpqI2EI
So in 62 years have we improved the state of the art in design by as much as between 1900 to 1962?
Yes. I'd say we have and more.
In that question, he's considered not with implementation or how good the execution of an idea is (which is certainly one type of progress), but in genuinely new ideas.
I don't think I personally am qualified to say yes or no. There are new data structures since then for example, but those tend to be improvements over existing ideas rather than "fundamental new ideas" which I understand him (perhaps wrongly) to be asking for.
https://stackoverflow.com/questions/432922/significant-new-i...
programs like houdini are more reactive and mathematical (no need to create width/volume by hand and trim intersections by hand), i think mech engineering tools (memory fail here) have options like this
In freecard there are parametric tools which are very much like what was shown in the demo but in 3d.
I tend to use script which render to openscad for the parts that I want to be parametric.
I'd rather say that visual tools are better abstractions than what text based tools can provide for those specific scenarios. Some problems are easier solved with diagrams.
(I do make sure that anybody learning from me understands that debuggers are not evil, they're just not my thing, and that shouldn't stop everybody else at least trying to learn to use them)
Of course you can abstract away a bit with functions or intermediate values in programming, but at one point if you do that too much you now have a bunch of indirection that harms overall readability.
All a balance of course, but "what takes part in this calculation" often feels more valuable than "what is the calculation itself".
https://www.mathworks.com/help/simulink/ug/power-window-exam...
Where statechart design is appropriate, it is a very powerful tool.
For those following along at home, click https://uk.mathworks.com/help/simulink/ug/powerwindow_02.png first and then realise that's a top level chart with per-case sub charts (and then follow buescher's link if you want to see those) ... and that at the very least this is probably the Correct approach to developing and documenting a design for something like that.
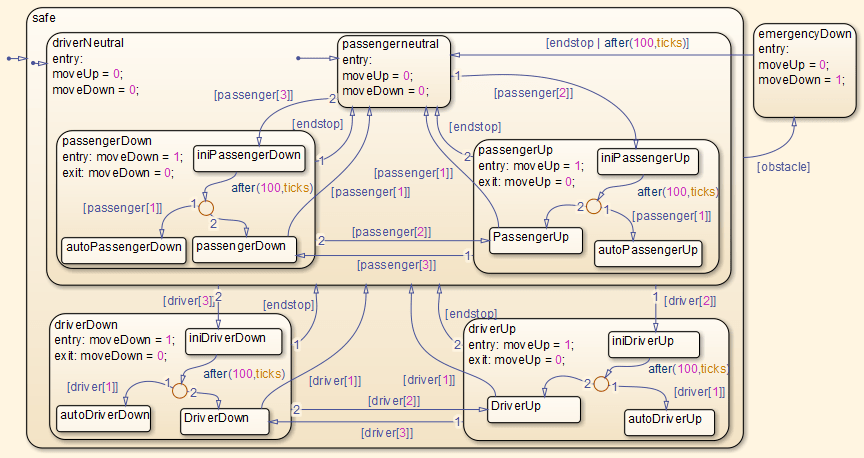
Thank you kindly for the Informative Example.
Remember, too, this is undoubtedly a simplified example. Just off the cuff I'd expect a real-world window motor controller in 2024 to have at least open-loop ramp-up and ramp-down in speed, if not closed-loop speed control. I also would expect there'd be more to their safety requirements.
I must have failed to understand even more things than I thought I did. I'll have to read through again when more awake if I want to fix that, I suspect.
I think if faced with that class of problem (am not automative developer, just spitballing) I would probably try using some sort of (no, not YAML) config format to express the various things.
But that's a 'how my brain works' and I am aware of that - for database designs, I've both ensured there was a reasonable diagram generated when the point of truth was a .sql file, and happily accepted an ERD as the point of truth once I figured out how to get a .sql file out of it to review myself.
Generally if you have a state machine or state chart with more than a few states, it's worth implementing as a table. The "config format" is then an array in a source file. There is a standard interchange format, scxml, for statechart tooling and libraries, but if you're implementing your state machine directly from a whiteboard drawing, you might not bother with it.
It's still great for simulation work imo.
Then there is the reality: every single one of Simatic projects I have seen was done by “PLC programmers” and had this peculiar feature of using the abstractions the wrong way around. Straightforward logic written as Instruction Lists (ie. assembly that produces the bytecode) and things that were straightforward sequential programming built from ridiculously complex schematic diagrams.
Contrast this with symbolic code. Especially with the advent of optimizing compilers, you get very little to no reliable intuition on the order things operate. Or, even, how they operate.
Now, this is even crazier when you consider how people used to model things mathematically. It really drives home why people used to be far more interested in polynomials and such. Those were the bread and butter of mathematical modelling for a long time. Nowadays, we have moved far more strongly into a different form of metaphor for our modeling.
Like, the 'flow' is really clear. Adding a feedback, saturation or integral or whatever is clear to the eye.
Stateflow charts are also a really nice way to do statemachines, which are used alot in automotive.
Simulink is terrible in many ways too, but in some perverted way I like it for the specific usecase.
Agreed. But it needs to stop there. BTW I never understood why the tool needs to know what processor the code is for. I asked them to provide a C99 target so they don't need to define their own data types in generated code. Does that exist yet? Or do they still define their own UINT_16 types depending on the target?
> Agreed. But it needs to stop there.
Heh. Ye ... about that.
It becomes presumptive to assume that Lisp is the be all, end all of car networking woes. Even if you accept that a tool to manage and organize computational tasks using a more functional paradigm would be helpful, that doesn't mean that a somewhat archaic, syntactically maligned language is the answer.
ROS tackles this somewhat yeah? But it's still very much a research project, despite its use in some parts of industry. The most significant development for computation in vehicles in recent times is still the automotive Linux efforts, so we are not really even in the ballpark to discuss specific languages.
As someone who cut their teeth on a graphical language and is a big diagramming person, it's always been curious to me as to why people want to write out stuff in text. It often feels extremely primitive. I've done large codebases in a graphical language before, and it felt so easy to orient myself as to where I was at in the system. In text-based languages, I feel lost in a sea of text that has almost zero differentiating factors.
There are few more things, like wherever a GUI component relevant to a case was missing, the tool provided a way to add a javascript snippet, eventually on some canvases all you see is JS components talking to each other. At that point you are better off writing plain JS code.
It dates to at least the 1940s with signal flow graphs (1) but from what I've heard, Shannon was working on fire control systems for the Navy and his work was classified. Some of that was famously published in A Mathematical Theory of Communication (2) where there are block diagrams for information systems, and Mason worked out Mason's Gain Rule/Formula in the early 1950s.
I would not be surprised if graphical representations date back to the 1920s/30s when abstracting electrical systems into things like circuit diagrams that ignore grounding were pretty common, or even earlier.
I did a little digging, and it turns out I had it backwards. It's not that Simulink invented a new graphical programming language to do this stuff. Control systems engineers have been studying and documenting systems using Simulink-style block diagrams since at least the 1960s. Simulink just took something that used to be a paper and chalkboard modeling tool and made it executable on a computer.