   Geekbench 6 (Single-Core)
   M1 Ultra       2436
   Ryzen 7945HX3D 2890
Gamer Nexus has several videos on the topic around PBO and Eco mode.
https://images.anandtech.com/doci/16084/Power%20-%2015W%20Co...
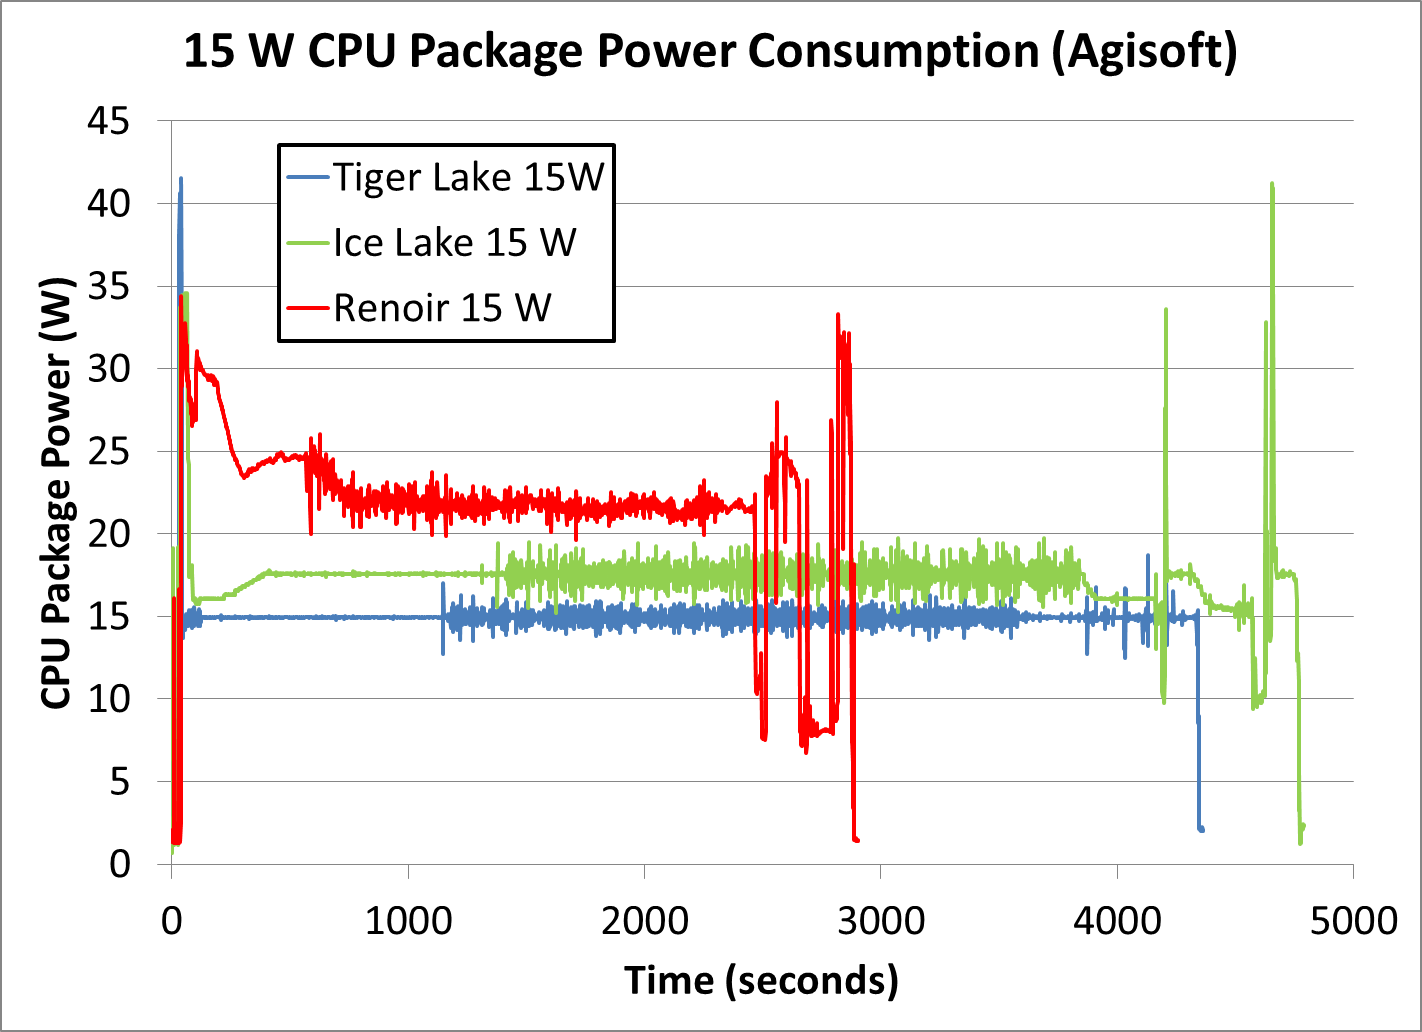
That's why I said: you have to look at the actual power measurement and not just the box spec, because Apple generally undershoots the box-spec for cpu-only tasks, and AMD always exceeds it substantially due to boost. Obviously if you give the AMD processor twice the power it's going to be competitive, that's not even in question here. The claim was, more efficient than Apple - and you simply cannot assess that with the box TDPs, or even cTDPs, because x86 processors make a mockery of the entire concept of TDP nowadays.
(and it didn't use to be like that - 5820K and 6700K would boost to full turbo under an AVX2 all-core load within the rated TDP! The "boost power is not the same thing as TDP" didn't come around until Ryzen/Coffee Lake era - accompanied by ploppy like "electrical watts are not thermal watts" etc)
https://www.anandtech.com/show/8426/the-intel-haswell-e-cpu-...
https://www.anandtech.com/show/9483/intel-skylake-review-670...
edit: notebookcheck has cinebench R15 at 36.7 pt/w for M3 Max and 33.2 pt/w for 7840HS, and 28 pt/w for Pro 7840HS (probably a higher-cTDP configuration). Obviously CB R15 is miserably old as a media benchmark, but perhaps ironically it might be old enough that it's actually flipped around to being more representative for non-avx workloads lol.
CB24 MT at 50% higher for M3 Max and CB R23 at 11% higher (shows the problem there with x86 processors on R23). Looking back at Anthony's review-aggregator thing... they're using the highest score for 7840HS I would assume (it's 1k points higher than median on notebookcheck) and also they're probably comparing box TDPs, which is where the inversion comes from here (from parity to a 10%-ish lead on efficiency). Because actual measurements of the M3 Max, from actual reviewers, have CB 2024 at around 51W all-core, and it almost doubles a 7840HS's score there.
https://youtu.be/BpeVdHwaHWU?t=644
And looking at it a little further even that nanoreview aggregator thing doesn't claim 7840HS is more efficient... they rate the M3 Max as being 16% more efficient. Seems that is a claim Anthony is imputing based on, as I said, box TDP...
edit: I’m also not even sure that nanoreview article has the right TDPs for either of them in the first place…
"We don't have comparisons because nobody checks but Apple is better" is not convincing to me.
This is more Intel than AMD. AMD will generally stick to the rated TDP unless you manually reconfigure something.
> and usually not reached unless it’s a mixed cpu-gpu load like gaming.
For mobile chips you'll generally hit the rated TDP on anything compute-bound in any way, simply because the rated TDP is low enough for a single core at max boost to hit it. And you'll pretty much always hit the rated TDP on a multi-threaded workload regardless of if the GPU is involved because power/heat is the limit on how high the cores can clock in that context, outside of maybe some outliers like very low core count CPUs with relaxed (i.e. high) TDPs.
> you have to look at actual measurements from actual devices in a particular workload.
But then as you point out, nobody really does that. Combined with the relative scarcity of parts made on the same process, direct comparisons of that kind may not even exist. Implying that the people saying the Apple processors are more efficient on the same process are doing so with no real evidence.
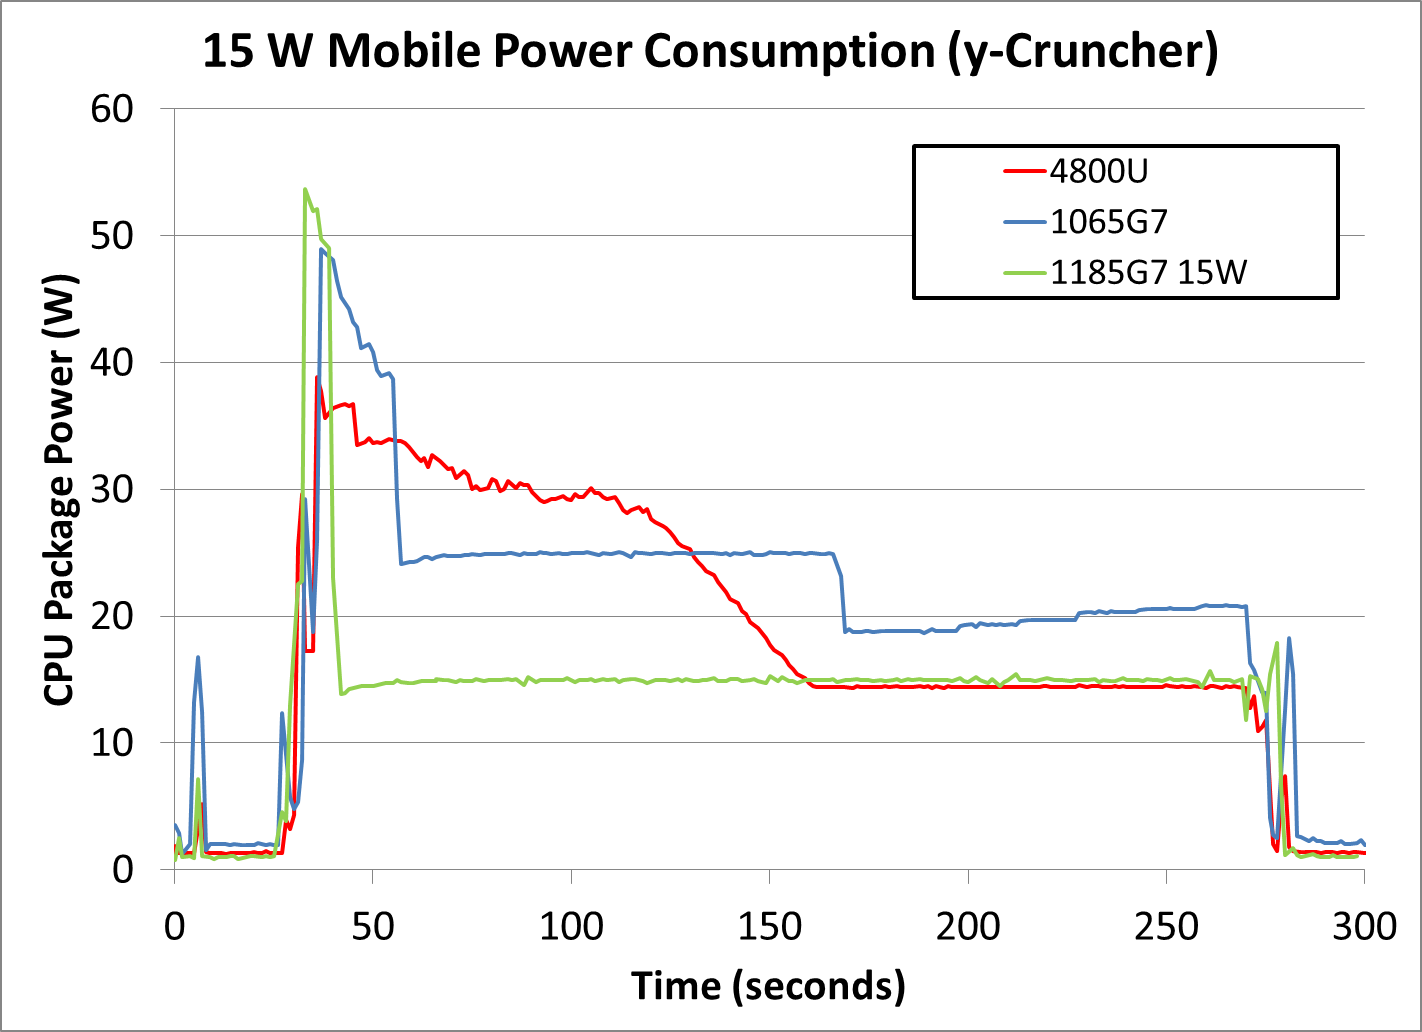
no, it's generally the opposite. Intel tends to exceed TDP substantially due to boost, and AMD actually exceeds it by greater margins than Intel.
This is consistent across both desktop and laptop, but AMD's mobile SKUs are actually allowed to exceed TDP by even larger margins than the desktop stuff.
https://images.anandtech.com/doci/16084/Power%20-%2015W%20Co...
https://www.anandtech.com/show/16084/intel-tiger-lake-review...
But the TDP is also configurable. It's one of the main differences between different model numbers with the same number of cores which are actually based on the same silicon. The difference between the 4800U and the 4900H is only the TDP and the resulting increase in clock speed. But the TDP on the 4900H goes up to 54W.
Whereas the TDP on the 4800U they tested there is configurable even within the same model, from 10-25W. And then we see it there using a sustained 20-25W, which is perfectly within spec depending on how the OEM configured it. And there is presumably a setting for "use up to max power as long as not thermally limited", which is apparently what they used, and then combined it with a 15W cooling solution. Which is what you see clearly in the first graph on the same page:
https://images.anandtech.com/doci/16084/Power%20-%2015W%20Co...
It uses more power until the thermal solution doesn't allow it to anymore.
In the second test it can sustain a higher power consumption, maybe because the test is using a different part of the chip which spreads the heat more evenly instead of creating a hot spot. But this is all down to how the OEM configured it, regardless of what they advertised. That CPU is rated for up to 25W and is only using 22. Obviously if the OEM configures it to use more, it will.
Pointing to TDP as if it meant anything compared to actual power measurements is usually a mistake. It doesn’t mean anything anymore.
Cinebench R23 is also not a particularly great test compared to SPEC2017, Geekbench 6, or Cinebench 2024, and most vendors still haven’t switched over even to the newer CB2024. Generally the older tests tend to give x86 a bit of a handicap because of the very simple test scenes.