Re:Poll: What's Your Most Disliked Programming Language?
by attractivechaos on Saturday March 24, 2012 @11:57AM
(#3749653)
I like it. It is possible to show the other poll (on favorite languages) along side? Thank you!
[ Parent
| on HN ]
Re:Poll: What's Your Most Disliked Programming Language?
by asjo on Saturday March 24, 2012 @04:43PM
(#3750651)
Yes, here is a scatter plot:
· http://koldfront.dk/misc/hn/pl/data.png
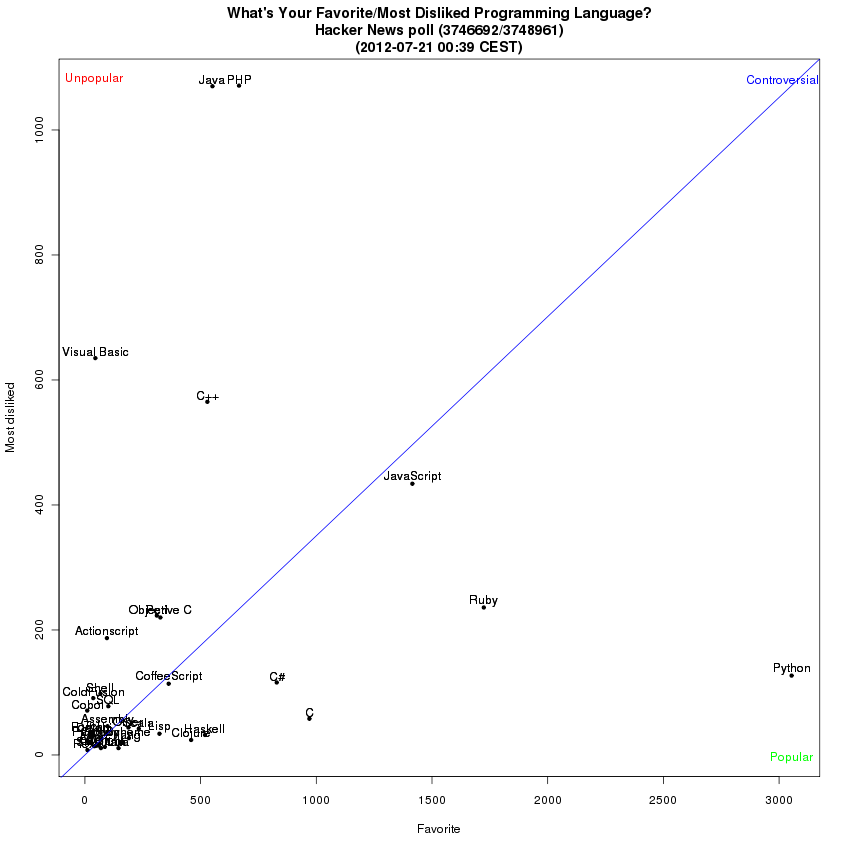
I would like to make a bar chart with favorite votes pointing up from the x-axis and dislike votes pointing down, but my rudimentary R skills doesn't stretch that far yet.
Here is the scatter plot on with log scales:

Re:Poll: What's Your Most Disliked Programming Language?
by robsteranium on Monday March 26, 2012 @03:10PM
(#3758179)
Haha! Great minds think alike. I just went through a very similar sketching sequence and reached basically the same conclusion!
I've plotted the positions using proportion of max votes (as a proxy for response rate) to account for the different number of voters responding to each poll (with actually counts added). And my axes are reversed!
The bipolar bar chart you're aiming at should be pretty easy to achieve if you first make the dislike values negative. I'm happy to write some code to demonstrate if you'd like.
edit: link - https://gist.github.com/2206278
Re:Poll: What's Your Most Disliked Programming Language?
by attractivechaos on Saturday March 24, 2012 @05:35PM
(#3750795)
Thanks a lot (and sorry for repeated post; there was something wrong with my browser)! I have also got my version of the plot: http://attractivechaos.github.com/votes.png
