Re:LibGen's Bloat Problem
by johndough on Sunday August 21, 2022 @09:25AM
(#32539954)
That graph of file size vs. number of files would be much easier to read if it were logarithmic. I guess OP is using matplotlib. In this case, use plt.loglog instead of plt.plot. Also, consider plt.savefig("chart.svg") instead of png.
[ Parent
| on HN ]
Re:LibGen's Bloat Problem
by liberalgeneral on Sunday August 21, 2022 @09:30AM
(#32539991)
Here is the raw data if you are interested: https://paste.debian.net/hidden/77876d00/
Thanks. Here is a logarithmic plot as SVG: https://files.catbox.moe/zbf35r.svg
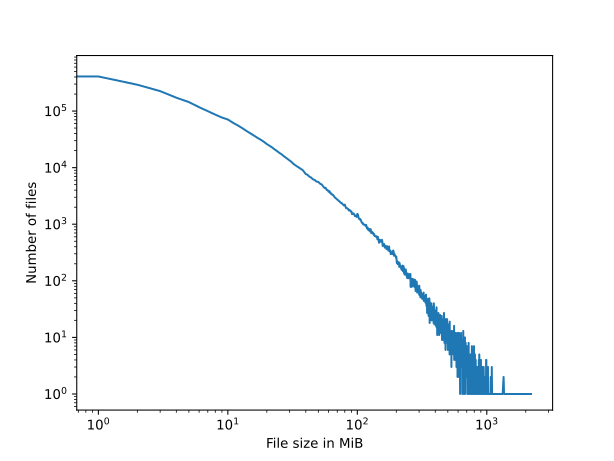
On a second thought, a logarithmic histogram might convey even more information, but that would require all file sizes to recompute the bin sizes.
Huh, this distribution is not the power law I would have expected. Maybe because it's limited to one media type (books)?
Well it's a log graph.