
This chart clearly shows multiple data points per resolution under the old fixed-ladder scheme, and under the new scheme the new data point for 1080p is lower on the video quality scale than any of the old 720p encodes. That's a pretty significant difference, and my question about where these new encodes fit into their existing price structure remains valid.
They're showing the curve that is used for connections that want to be streaming 4k. So if you're on the 1080 stream in the charted scenario, it's because you're bandwidth-limited. They have higher-quality, higher-bitrate encoding curves for lower-resolution connections. However, it doesn't make sense to use that 1080 encoding for a 4k connection. If you could afford the bitrate, you'd rather be streaming the higher resolution from the displayed curve.
> As a side note, we do have some additional points, not shown in the plots, that are used in resolution limited scenarios — such as a streaming session limited to 720p or 1080p highest encoding resolution. Such points lie under (or to the right of) the convex hull main ladder curve but allow quality to ramp up in resolution limited scenarios.
Edit: Looking at their animated GIF comparisons, the newer encodes definitely give a much sharper image, but also have a lot more in the way of ugly artifacts:
On the left, under the tree branch: https://miro.medium.com/max/2000/1*SQQkYltbVC-HT-l8GpN-7Q.gi...

The right side of the frame: https://miro.medium.com/max/2000/1*A37BBzK4Ap8JPhmiUiFKcw.gi...
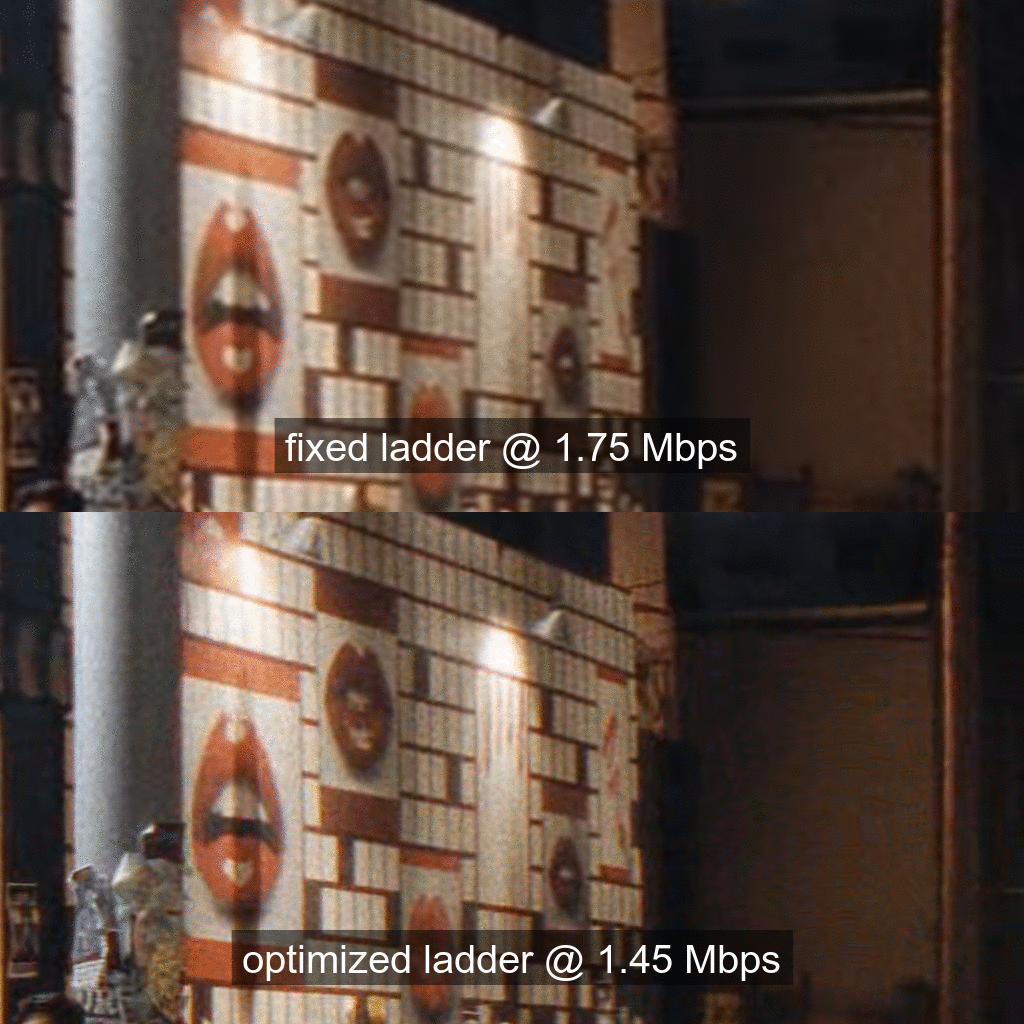
Many of the areas that should be fairly flat looking: https://miro.medium.com/max/2000/1*qI3EY7HDp3p0gwK9YGqchQ.gi...
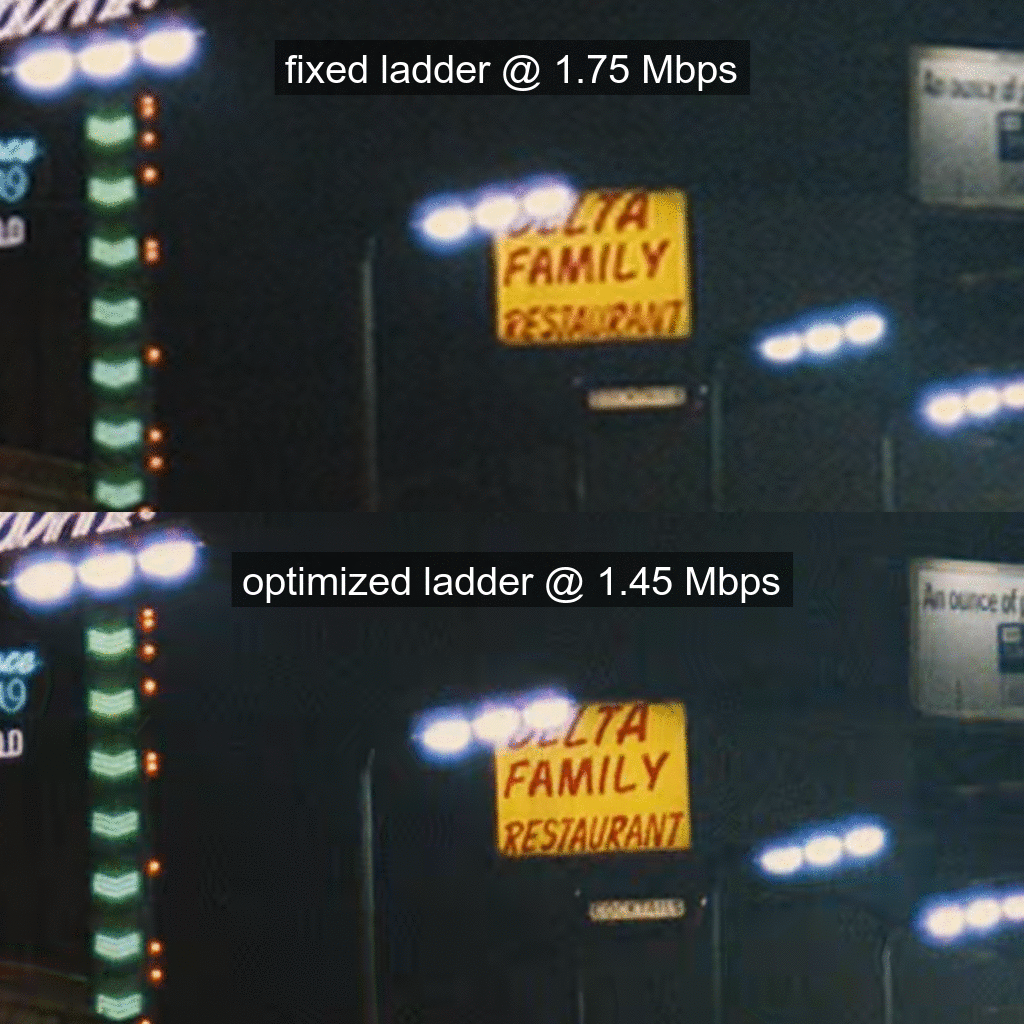
There's definitely a lot more ringing and similar artifacts in the newer, lower-bitrate samples despite their overall increase in effective resolution.