News for hackers. Stuff that matters.
Re:3D scatterplot of an image by pavel_lishin on Friday December 15, 2017 @07:46AM (#15931364)
This is cool, but I wonder why most of the demo images - and a lot of the images I uploaded - seem to have their colors aligned in a single plane.
Re:3D scatterplot of an image by abainbridge on Friday December 15, 2017 @08:19AM (#15931565)
Partly it is because real objects are often made out of a single colour. The camera sees different parts of the object under different lighting conditions. That mainly only changes the brightness. Specular highlights also desaturate the base colour, but nothing changes the hue. So all the pixels for that object tend to be aligned on a plane in the colour space plot.

In the example images, the sand in the sand+sky picture is the only thing this is really true for.

Re:3D scatterplot of an image by pavel_lishin on Friday December 15, 2017 @04:07PM (#15935124)
But I'd expect to see distinct clumps, not a straight plane...
Re:3D scatterplot of an image by abainbridge on Friday December 15, 2017 @05:04PM (#15935619)
Imagine you have a flat red piece of card in a photographed scene. If the lighting is just right and the card is matt, you could get all the pixels of the card in the image to be the exact same colour. That would be a single point in the colour space.

Now imagine you rolled the card into a cylinder. The result would depend on the lighting, but most likely you'd be able to see some shading across the object, so that there are some darker and lighter pixels. In, the HSV colour space you'd now have a line - all the H and S values for those pixels would be the same, but there would be a range of values for V.

Now imagine you replaced the matt card with a shiny piece. You might see a whitish specular highlights where the object reflects a light source or the sky. The added whiteness would have made some pixels have a lower saturation (S). So now you have variation in S and V, but not H. That would form a plane in the HSV plot.

Re:3D scatterplot of an image by pavel_lishin on Saturday December 16, 2017 @09:12PM (#15943576)
But the demos all form planes in RGB... look at them - most are basically thin cylinders.
Re:3D scatterplot of an image by gilleain on Friday December 15, 2017 @12:49PM (#15933574)
Try some paintings by Fahrelnis Zeid, such as this one:

http://beneast.com/wp-content/uploads/2017/09/fahrelnissa-ze...
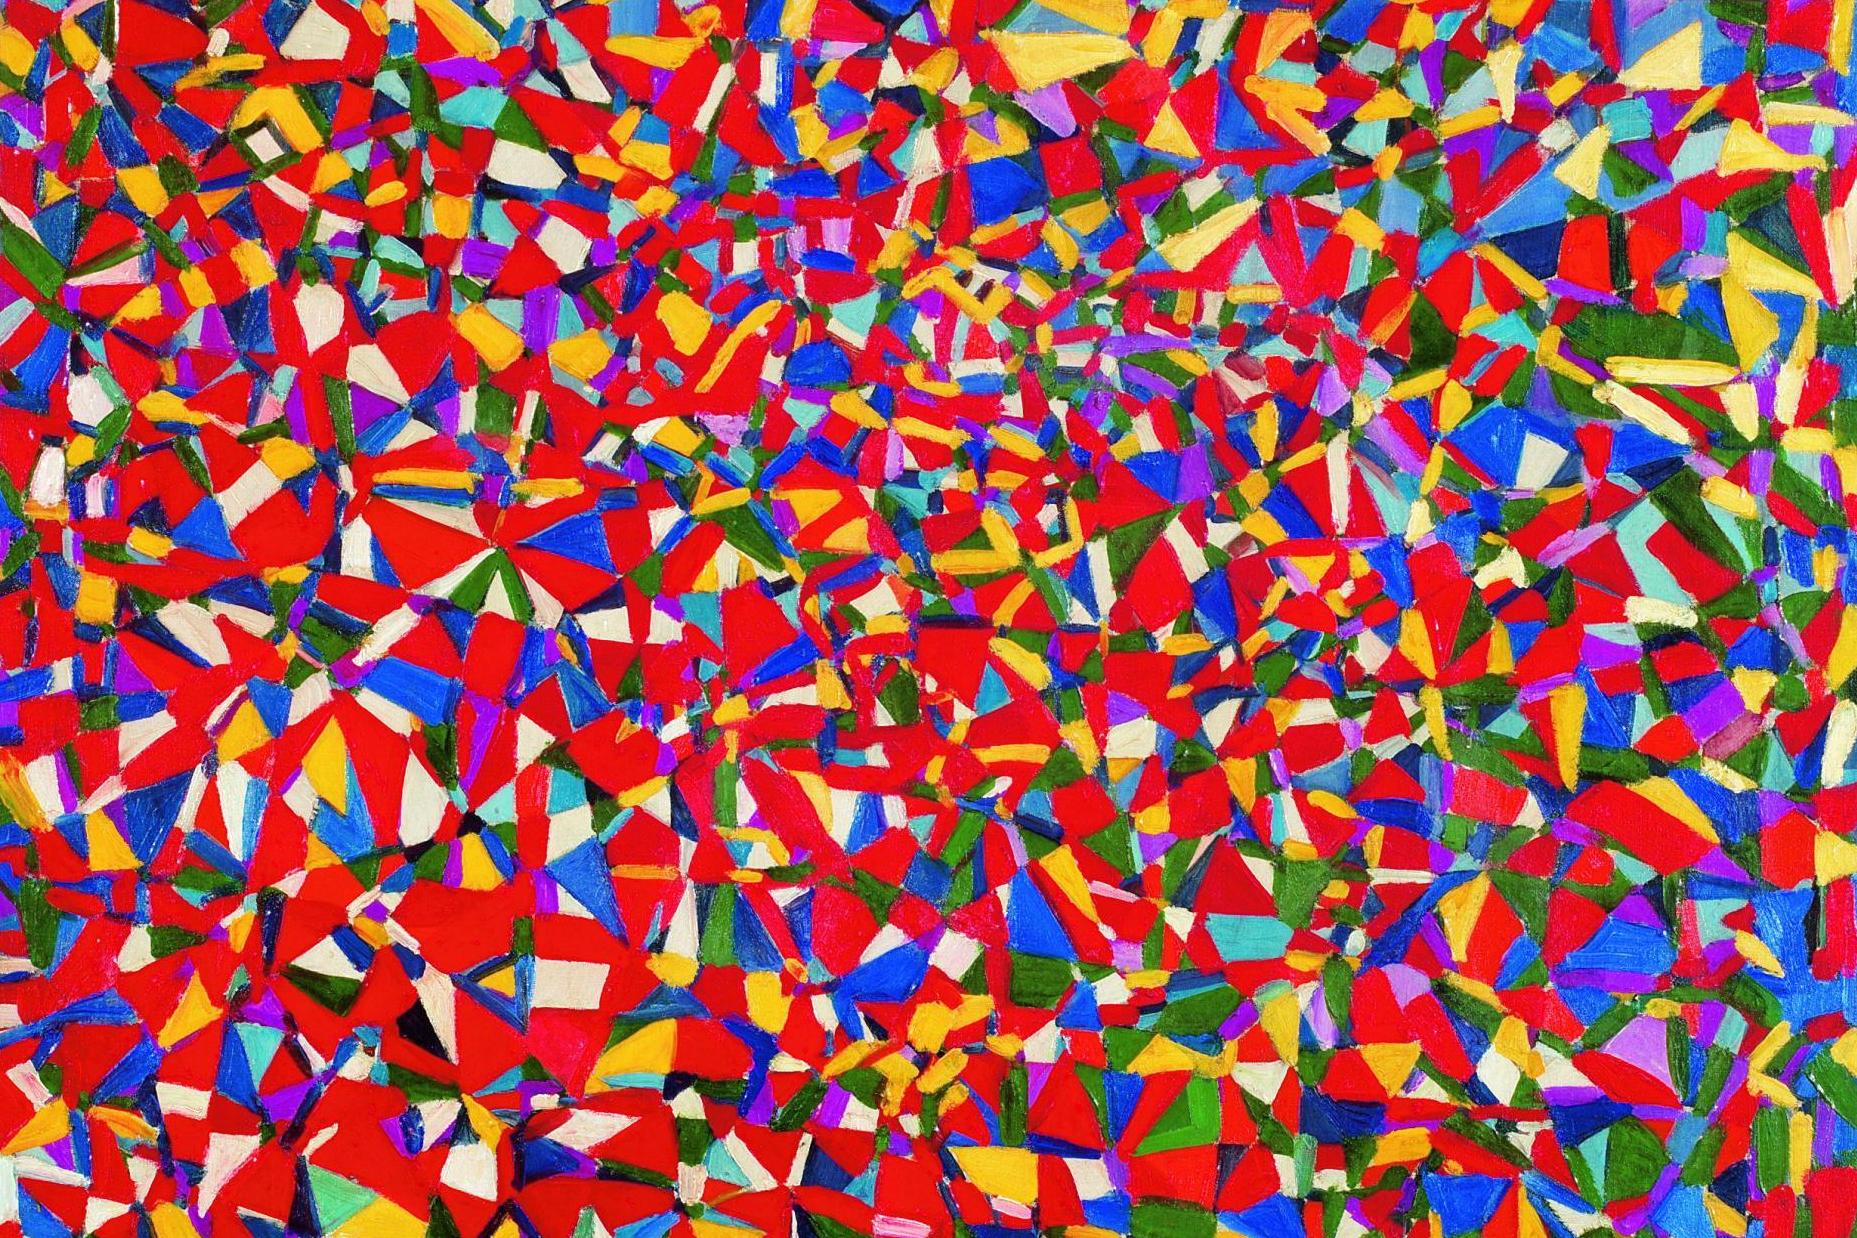
Re:3D scatterplot of an image by jpfed on Friday December 15, 2017 @01:56PM (#15934108)
Maybe planar colors make for better-looking images (a more cohesive feel) and the demo images were chosen because they look good.
Re:3D scatterplot of an image by pygy_ on Friday December 15, 2017 @07:05PM (#15936399)
That would have been my guess as well. I wouldn't have guessed that those paintings had such a planar palette

Well, not that flat actually, the way the image were processed also makes them flatter than they really are see

https://uploads2.wikiart.org/images/vincent-van-gogh/the-sta...

for example.

Re:3D scatterplot of an image by gt_ on Friday December 15, 2017 @08:33AM (#15931646)
The original values are 3 dimensional and therefore best represented in a cube. If HSV is used, the hue is isolated to one dimension, which would represent the circumfrance of the color wheel you’re thinking of. The colors around the circular surface of your cylinder could be calculated from that, but you would be left with only one more display dimension and 2 more values: value (brightness/darkness) and saturation. You could only display one of them in the single empty dimension left in the cylinder.

Another way to explain why a cylinder is only good for representing two dimensions is simply that a circle asserts that length(x) == width(y) leaving only 2 values represented by a cylinder: (x,y) and z.

Re:3D scatterplot of an image by akrasuski1 on Friday December 15, 2017 @08:01AM (#15931442)
Hmm, I guess someone would have thought of that, but this could probably be used for compressing images by reorienting the color axes so that one of them is perpendicular to this color plane, and then sending less information about that coordinate.
Re:3D scatterplot of an image by abainbridge on Friday December 15, 2017 @08:25AM (#15931602)
Yeah, you can use principle component analysis to figure out the transform to make the colour space "optimal" for compression of a specific image. I tried that once:

https://bainbridgecode.wordpress.com/2012/04/24/beating-png-...

and

https://bainbridgecode.wordpress.com/2012/05/07/beating-png-...

There are plots at the end of part 3 showing the image channels separately for YCrCb and my custom PCA derived space. They clearly show that there's a lot less duplication of data between channels with the latter. And that in turn is obviously good for compression.

Re:3D scatterplot of an image by thomasahle on Friday December 15, 2017 @10:29AM (#15932443)
Finding the first primary component also appears to be a pretty good way greyscale an image.
Re:3D scatterplot of an image by iainmerrick on Friday December 15, 2017 @08:16AM (#15931548)
Re:3D scatterplot of an image by Overv on Friday December 15, 2017 @08:12AM (#15931514)
I'm not sure. It's hard to say because RGB is a bad representation of the color semantics anyway. Try visualizing the images in HSV/HSL/LAB space instead.