First, it's based on the same older self-reported exit polling that led 538 to completely mispredict the election, so you should immediately be skeptical of the data.
Second, it only takes into account self-reported current income blocks, not change in income over the last decade or so, which is what many Trump voters are angry about. For example, making $70k today might seem ok if you look at the table and see median state income is only $65k, but that means nothing to someone who made $90k in 2007 and has never been able to get income back to that level.
Third, it also ignores future predictions based on current state of affairs for voters. It's not very comforting if you make higher than the median income in your area, but your job is on the chopping block. Trump picked up far more non-college educated voters, for whom future job prospects look worse and worse every year, even if they have gainful employment today.
[1] http://www.bls.gov/nls/ [2] http://www.businessinsider.com/us-factory-workers-used-to-li...
Exit polls show that Trump made massive gains in the under 30k and the 30-49k brackets, compared to the previous election.
Higher than 50k income brackets leaned more towards clinton than in the previous election.
http://www.nytimes.com/interactive/2016/11/08/us/politics/el...
This is the old American middle class that did well without a degree usually employed in manufacturing and who usually reliably voted democrat.
Overlay this map:
http://www.nytimes.com/interactive/2016/11/08/us/elections/h...
With maps like this one:
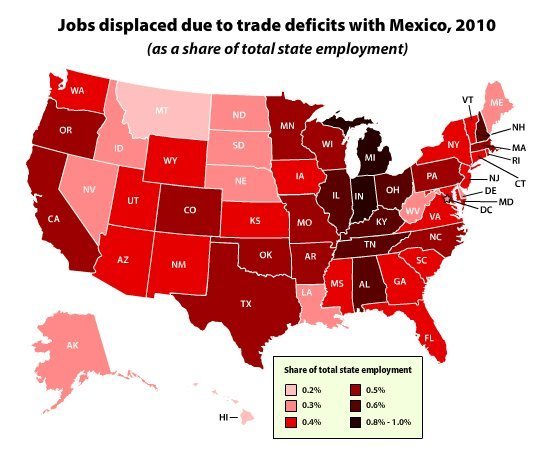
It's why he won. There's no way Pennsylvania (first time since 1988) and the Rust Belt go to him otherwise.
http://fivethirtyeight.com/features/the-mythology-of-trumps-...