ptvan
I did study for the real estate licenses in California and Nevada. The textbook for the course explicitly recommended that seller's agents tell the seller that the buyer pays the fees, and buyer's agents tell the buyer that the seller pays the fees.... to distract from this price-fixing scam.
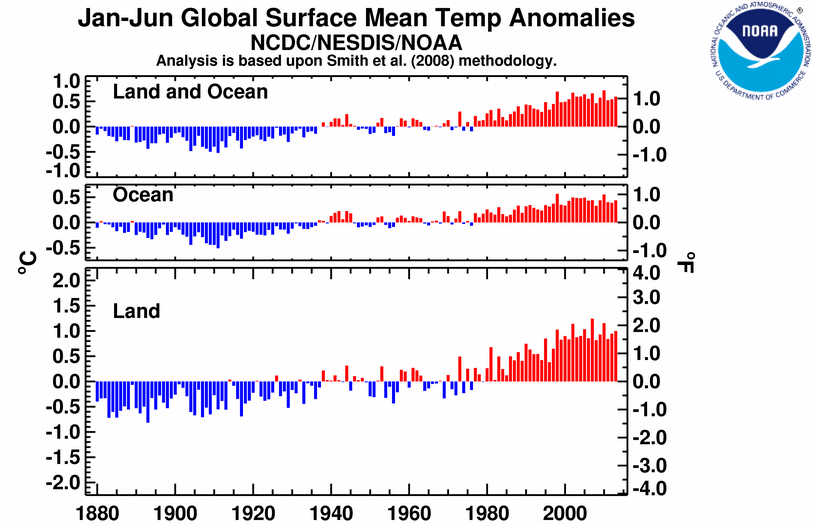
I'd like to incorporate this bar chart, because I saw some tweets claiming that this project is evidence that global warming is not real. That annoys me.
http://www.ncdc.noaa.gov/sotc/service/global/glob/201301-201...
And yes, we will write a post on what we learned in making it!
theres a difference between creating pixel perfect polished marketing sites and showcasing an evolving prototyping tool
being able to change the parameters of animations/simulations and see the results in real time is pretty incredible.
amen brother!
unfortunately, they had to take it down, but here's the punchline: http://24.media.tumblr.com/tumblr_kt5pgoInM81qaoem1o1_r1_500...

I think in the west, we're mainly controlled by entertainment, not violence. (I guess you could call it intellectual/emotional violence.) http://24.media.tumblr.com/tumblr_kt5pgoInM81qaoem1o1_r1_500...
It was also an opportunity to learn TileMill (mapbox.com/tilemill) to generate that styled map.. I recommend checking it out if you like maps/geodata.
There are two approaches to visualiation: exploratory - When you don't know what the data looks like, you use this to find out what's there. expository - When you do know the data, you can use this approach, which is what the Twitter and Facebook infographics are. We designed the templates around the known scale and range of the data.
If these templates don't work for you, there's additional variety and customization to come that will abide by standards of analysis and visualization.. :)